Large-Scale Hunting and Collection from Immature Networks

Incident Responders often find themselves investigating computer incidents for clients who may not have the best security posture – lack of centralized SIEM logging, mature EDR deployment and general inability to centrally query or otherwise collect data from across the network.

This is a real problem when investigating – it means you can’t rapidly pivot on Indicators of Compromise (IOCs) such as IP addresses/Ports, Process information (names, commandlines, etc), User activity, Scheduled Task or Service metadata such as known-bad names or binaries and other system information. Without centralized tooling or logging, using IOCs or Indicators of Attack (IOAs) can be extremely difficult.

I’ve previously made some scripts to aid my own objectives to solve this problem such as WMIHunter (https://github.com/joeavanzato/WMIHunter/tree/main) and variations of using WMI at-scale in C# and Go respectively – but recently I wanted to revisit this problem and make a more modular and flexible solution.

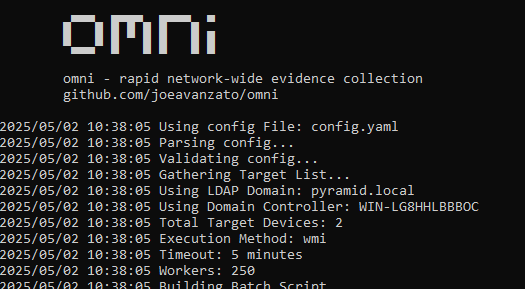
I’d like to introduce a tool I wrote aimed at solving this problem and providing DFIR professionals another open-source solution – hence, omni [https://github.com/joeavanzato/omni].

At its core, omni is an orchestration utility providing analysts the means to execute commands on hundreds or thousands of remote devices simultaneously and transparently collect and aggregate the output. This means any command, script, tool or anything else that you as an analyst want to execute and collect some type of output from, omni helps make that easy to achieve at-scale.

Can omni help you?

Ask yourself these questions – if the answer to any of these is ‘yes’, omni can help you.

  • Do you have a need to execute and collect the results of one or more commands/scripts/tools on multiple devices concurrently?
  • Do you need to collect data from a large amount of devices that are not connected to the internet?
  • Have you ever run into issues trying to rapidly pivot on indicators of compromise across a large number of devices due to lack of data/logging/agents?
  • Does the current environment lack a centralized logging solution or EDR that can help you quickly query devices?
  • Do you need to execute a series of triage scripts on 1 or more networked devices?

As an example, let’s consider running processes and TCP connections – both are extremely common to collect to aid reactive hunts on known-bad during an engagement. omni works by allowing users to build a YAML configuration file containing command directives to be executed on targets – we can add, subtract or modify from this file as needed to serve any type of unique requirements. Below is an example of one way you could capture this data with omni:

command: powershell.exe -Command "Get-WmiObject -Class Win32_Process -Locale MS_409 -ErrorAction SilentlyContinue | Select PSComputerName,ProcessName,Handles,Path,Caption,CommandLine,CreationDate,Description,ExecutablePath,ExecutionState,Handle,InstallDate,Name,OSName,ProcessId,ParentProcessId,Priority,SessionId,Status,TerminationDate | Export-Csv -Path '$FILENAME$' -NoTypeInformation"
file_name: $time$_processes.csv
merge: csv
id: processes
tags: [quick, process, processes, builtin]

The above configuration tells omni to run the PowerShell command, automatically replacing any placeholder variables with the specified file-name – then omni knows that once collection is done, this file-name should be collected from the targets.

It is also possible to copy a script to the target and execute this, allowing omni to facilitate analysts with running more complex triage tools remotely.

command: powershell.exe C:\Windows\temp\ExtractLogons.ps1 -DaysBack 14 -OutputFile $FILENAME$
file_name: $time$_LogonActivity.csv
merge: csv
id: LogonActivity
tags: [access, user, builtin]
dependencies: [utilities\ExtractLogons.ps1]

The dependencies block allows users to specify one or more files or directories that this directive requires exist on the target prior to execution – dependencies are always copied into a single directory (C:\Windows\Temp) and then removed once execution is complete. Dependencies can also specify an http file that will be retrieved during parsing configuration.

dependencies:[https://raw.githubusercontent.com/joeavanzato/Trawler/refs/heads/main/trawler.ps1]

Typically though, if your configuration requires some remote files for download, you will be better off using the Preparation section of the configuration – this allows for commands to be executed for preparing the analysis environment – usually this means downloading any necessary tools that you want to deploy to targets, such as Autoruns or the Eric Zimmerman parsing toolset.

preparations:
  - command: powershell.exe -Command "iex ((New-Object System.Net.WebClient).DownloadString('https://raw.githubusercontent.com/EricZimmerman/Get-ZimmermanTools/refs/heads/master/Get-ZimmermanTools.ps1'))"
    note: Download and execute Get-ZimmermanTools into current working directory
  - command: powershell.exe -Command "iwr -Uri 'https://download.sysinternals.com/files/Autoruns.zip' -OutFile .\Autoruns.zip ; Expand-Archive -Path Autoruns.zip -Force"
    note: Download and unzip Autoruns

This can be used to help ensure that required dependencies exist prior to executing your configuration.

When omni runs, it will create two folders – ‘devices‘ and ‘aggregated‘ – inside devices a directory is created for each target device that will contain all data collected for that target. Aggregated will store any merged files once collection is complete depending on configuration settings – for example, all running processes for all computers if using the first config specified in this post.

Devices folder contains individual results, Aggregated folder contains merged results from all devices

Keep in mind – omni is designed to facilitate rapid and light-weight network-wide hunting – although it is of course possible to execute and collect any type of evidence – for example, launching KAPE remotely and collecting the subsequent zips from specified targets, like below:

command: C:\windows\temp\kape\kape.exe --tsource C --tdest C:\Windows\temp\kape\machine\ --tflush --target !SANS_Triage --zip kape && powershell.exe -Command "$kapezip = Get-ChildItem -Path C:\Windows\temp\kape\machine\*.zip; Rename-Item -Path $kapezip.FullName -NewName '$FILENAME$'"
file_name: $time$_kape.zip
merge: pool
id: kape
add_hostname: True
dependencies: [KAPE]

Of course, doing this across thousands of devices would results in a massive amount of data, but for a more limited scope this could be a highly effective means of collecting evidence – choose your configurations and targets carefully.

Below are some common command-line examples for launching omni:

omni.exe -tags builtin
- Launch omni with all targets from .\config.yaml having tag 'builtin' with default timeout (15) and worker (250) settings, using Scheduled Tasks for execution and querying AD for enabled computers to use as targets

omni.exe -workers 500 -timeout 30 -tags quick,process
- Add more workers, increase the timeout duration per-target and only use configurations with the specified tags

omni.exe -targets hostname1,hostname2,hostname3
omni.exe -targets targets.txt
- Use the specified computer targets from command-line or file

omni.exe -method wmi
- Deploy omni using WMI instead of Scheduled Tasks for remote execution

omni.exe -config configs\test.yaml
- Execute a specific named configuration file

Ultimately, you can use omni to launch any type of script, command or software remotely at-scale on any number of targets. I’ve often found myself on engagements for clients who lack effective SIEM or EDR tooling, meaning that when we find something like a known-bad IP address, Process Name, Binary Path, Service/Task Name or some other IOC, we have no way to effectively hunt this across the network.

omni comes with a pre-built configuration file that contains directives for common situations such as collecting running processes, TCP connections, installed Services/Tasks, etc (https://github.com/joeavanzato/omni/blob/main/config.yaml). Prior to use, you should customize a configuration that meets your collection needs depending on the situation at hand. omni also includes some example configuration files for specific use-cases at https://github.com/joeavanzato/omni/configs.

Please consider omni during your next engagement in a low-posture network suffering a cyber incident. If you experience any bugs, issues or have any questions, please open an Issue on GitHub. I am eager to hear about feature requests, ideas or problems with the software.

Ransomware Simulation Tactics

“The only real defense is active defense” – organizations must be proactive in their pursuit of cybersecurity defense else when a real adversary turns up, they will be completely outmatched.

When it comes to ransomware, enterprises adopt all manner of defensive posture improvements with the goal of early detection and prevention – this usually includes tuning EDR, implementing network segregations, data monitoring mechanisms for the truly mature and sometimes bespoke “ransomware prevention” solutions designed to halt threat actors mid-encryption through agent-based solutions or otherwise.

The one thing that tends to be overlooked is the actual act of adversary emulation – simulating a true-to-life ransomware payload detonation to ensure it will be detected or prevented with current controls.

This is where impact comes in. Impact is a tool I developed to help organization’s be more proactive about their defense and simulate a realistic ransomware threat in their network – it is highly configurable, highly modular and will help blue teams be more confident in their detection and prevention strategies.

Beyond file encryption, impact is designed to truly emulate a modern ransomware payload – this includes a variety of deployment options, offensive capabilities and a modular configuration to tailor it each individual enterprise requirements.

For example, impact offers the below options:

  • Adjust level of concurrency for encryption/decryption
  • Filter by filename/extension/directory for file targets
  • Utilize hybrid encryption to benefit from fast symmetric encryption of file data and protect each symmetric key with an asymmetric public key
  • Capability to create a set of mock data for later encryption/decryption tests
  • Capability to terminate configured processes and services that may interfere with encryption operations
  • Capability to block selected ports/domains via Windows Firewall to tamper with EDR/Backup communications
  • Capability to eliminate all Volume Shadow Service (VSS) copies to tamper with potential backups
  • Capability to tamper with Windows Defender settings
  • Capability to deploy on remote devices from a list of targets or Active Directory using Windows Services, Scheduled Tasks or WMI
  • Capability to enumerate local/network drives for complete system encryption
  • Capability to emulate a number of different ransomware threat actors, including mimicking their commonly used ransomware note names, extensions, note contents and encryption algorithms among other things
  • Implements a configurable intermittent-encryption scheme for efficiency

impact has lots of optional features and modularity to allow it to support a variety of use-cases and requirements when it comes to ransomware simulation on a per-environment basis.

So how do I use it?

At the core, it is extremely simple to ‘just encrypt’ a directory using the following command (you don’t even need to specify a group, it will pick one at random):

impact.exe -directory "C:\test" -group blackbasta -recursive

When you execute this, it will crawl C:\test and encrypt any files matching inclusion/exclusion filters with parameters associated with the BlackBasta group as specified in config.yaml. Each encryption command will generate a corresponding decryption command inside decryption_command.txt – this will typically look something like below:

impact.exe -directory "c:\test" -skipconfirm -ecc_private "ecc_key.ecc" -cipher aes256 -decrypt -force_note_name ReadMe.txt -recursive

impact comes preloaded with embedded public and private keys for use if you don’t want to use your own – it’s also possible to generate a set of keys using the -generate_keys parameter – these can be subsequently fed into impact for use rather than relying on the embedded keys.

impact.exe -directory "\\DESKTOP1\C$\Users" -group blackbasta -recursive -ecc_public ecc_public.key

The above command will force the use of ECC for hybrid encryption and overwrite any group settings. It is also possible to force a specific symmetric cipher via the -cipher argument like below:

impact.exe -directory "C:\test" -group blackbasta -recursive -ecc_public ecc_public.key -cipher xchacha20

Keep in mind – if you supply a personal public key for encryption, you will also need to supply the corresponding private key for decryption!

impact can also create a set of mock data for you to encrypt rather than needing to do that yourself – just run it like below to populate the targeted directory:

impact.exe -create -create_files 12000 -create_size 5000 -directory C:\test

The above command will create 12,000 files with a total approximate data size of 5 Gigabytes in the specified directory – then we can target this directory with encryption/decryption tests as needed.

When checking directories or files to decide if they should be encrypted, impact uses the built-in configuration file (customizable) to apply the following logic:

  • Does the file extension match an inclusion that should be targeted?
  • Does the file name match one that should be skipped?
  • Does the directory name match one that should be skipped?
  • Is the file size > 0 bytes?
  • Does the file extension match an exclusion that should be skipped?

Assuming a file passes these checks, it is then added to the encryption queue. When doing decryption, checks are skipped and every file in relevant directories is checked for encryption signatures to determine if we should attempt to decrypt it.

This pretty much covers the encryption/decryption facilities built into impact – but be aware you can also specify custom ransomware notes, ransomware extensions and a host of other optional features if you need to.

impact also contains a variety of offensive emulations commonly employed by encryption payloads – the ability to kill specific processes, stop specific services, block network traffic by port or domain (resolved to IP address) and attempting to disable/set exclusions for Windows Defender. These are all documented at the command-line level and behave pretty much as you’d expect.

impact can also be deployed remotely via WMI, Windows Service or Scheduled Task – you can supply a list of target hosts via the command-line, an input line-delimited file or have impact dynamically pull all enabled computers from the current Active Directory domain for targeting.

impact.exe -targetad -directory "*" -recursive -public_ecc keyfile.ecc -cipher xchacha20 -ep 50 -workers 50 -exec_method wmi

The above command will pull all enabled computers from AD and copy impact to the ADMIN$ share via SMB then attempt to launch it via WMI – all command-line arguments will be preserved and passed into the created process (minus obvious exceptions such as exec_method and targetad, to name a few).

There are a lot of TODOs, optimizations and features to add to this – but for now, it works and does the job of (mostly) accurately simulating ransomware and commonly associated TTPs.

If you think you can detect ransomware on endpoints or fileshares, try it out and prove it.

If you have any bugs or feature requests, please open an Issue on GitHub or drop me an email at joeavanzato@gmail.com.

RetrievIR: Forensic Artifact Retrieval in PowerShell

Whenever I can, I like to use PowerShell for DFIR tasks – it’s ubiquitous presence usually means less headaches when deploying tools in client environments. To that end, exploring what is available from an open-source perspective leads most people to a few options when it comes to common DFIR tasks and automations:

Let’s talk about each of these first.

Kansa is a highly-modular framework written in PowerShell that provides Incident Response teams the capability to easily query for common artifacts as well as perform some level of analysis on the results. It can be extended by writing custom PowerShell modules to retrieve evidence as required – unfortunately, it relies on PowerShell Remoting which in turn relies on Windows Remote Management (WinRM) – a feature that, in my experience, is frequently not enabled for Desktop endpoints in corporate environments.

PowerForensics is a library written in PowerShell and C# that exposes functionality allowing for users to, in their own tools, easily gather artifacts directly through parsing of the NTFS/FAT file system artifacts such as the $MFT. This is particularly useful when analyzing dead disks or otherwise locked data – it is not intended as a ‘live’ triage tool.

CyLR is a C# tool designed to aid front-line responders in the collection of common artifacts from live systems – unfortunately, the artifact selection is hard-coded into the tool rather than available via a configuration of any type. This makes it’s usefulness relatively limited in scope.

Finally, I would be remiss if I did not discuss Velociraptor – this awesome tool is great at helping teams gain visibility into endpoints at scale and comes packed with community-contributed modules for collecting evidence. Velociraptor is ALSO capable of generating offline evidence collection packages but these must be configured ahead of time via the GUI – often this can be overkill, especially if you are not already used to the tool or don’t have it deployed in an easily accessible location.

There are some other common closed-source tools such as KAPE but these are typically not allowed to be used in paid engagements or third-party networks unless an enterprise license is obtained, making it less useful for smaller teams that cannot afford such a license.

Each of these tools is great in their own right – but I felt a need to create something to fill what I perceived as a gap – a standalone evidence collection (and parsing) tool with flexible evidence specification based on easy to read and create JSON files.

Introducing, RetrievIR [https://github.com/joeavanzato/RetrievIR] – a PowerShell script capable of parsing JSON configuration files in order to collect files, registry key/values and command outputs from local and remote hosts. At it’s core, RetrievIR is relatively simple – it will hunt for files that match specified patterns, registry keys that match provided filters and execute commands either in-line or from a specified file. Additionally, I’ve created a follow-up script called ParseIR which is designed to parse RetrievIR output using common tools such as the Eric Zimmerman set of parsers as well as some custom utilities that are still evolving.

One of the main goals in creating this was to help provide DFIR teams the capability to specify exactly what evidence they want to collect along with tagging and categorizing evidence – this means that one or more configuration files can be used in multiple ways as the operator can tell RetrievIR to only collect evidence that contains a specific tag or is part of a specified category rather than always collecting everything in the configuration file. Evidence specification does not require an individual to know how to program – everything is based in the JSON configuration including what paths to search, recursiveness, what files to filter on, what commands to execute, what registry keys to inspect and so-on.

RetrievIR is intended for use in assisting the live triage of endpoints – it collects raw evidence that is typically then processed into machine-readable information which can then be fed into centralized data stores for investigation (Elastic, Splunk, SQL, etc). RetrievIR configurations are described as JSON objects with different properties available depending on whether the target is the filesystem, the registry or a command execution. An example of each type of configuration is shown below.

{
	"files": {
		"Avast": {
			"category": "AntiVirus",
			"filter": ["*.log"],
			"recursive": false,
			"paths": [
				"%HOMEDRIVE%\\ProgramData\\Avast Software\\Avast\\Log\\*",
				"%HOMEDRIVE%\\ProgramData\\Avast Software\\Avast\\Chest\\*",
				"%HOMEDRIVE%\\Users\\*\\Avast Software\\Avast\\Log\\*"
			],
			"tags": ["sans_triage"]
		}
	},
	"commands": {
		"CommandLineConsumers": {
			"category": "WMI",
			"command": "Get-WmiObject CommandLineEventConsumer -Namespace root\\subscription  -ErrorAction SilentlyContinue | Select-Object * | Export-Csv -NoTypeInformation -Path '#FILEPATH#'",
			"output": "CommandLineEventConsumers.csv",
			"tags": ["sans_triage", "light"],
			"type": "WMI-CommandlineConsumers",
			"parser": "CSVOutputCollector"
		}
	},
	"registry": {
		"DefenderExclusions": {
			"category": "Antivirus",
			"paths": [
				"HKLM\\SOFTWARE\\Microsoft\\Windows Defender\\Exclusions"
],
			"recursive": true,
			"keys": ["*"],
			"store_empty": true,
			"tags" : ["sans_triage"]
		}
	}
}

This example configuration will tell RetrievIR to do three distinct things:

  1. Look for any file ending in ‘.log’ non-recursively at the 3 specified paths.
  2. Execute the provided command and output it to the File Name specified in ‘output’.
  3. Examine the provided registry path recursively and record any key:value stored in any path, including the current.

There are some other things going on but at it’s core, this is all that is required to use RetrievIR effectively and obtain evidence to help your team analyze systems. I’ll be writing more advanced articles covering tagging, parsing and additional properties available – but hopefully this has been enough to pique your interest and maybe help your team more rapidly triage live systems!

Link: https://github.com/joeavanzato/RetrievIR

Please check it out and provide feedback so I can make it better!

Common Commandlines

Capture the standard ‘SANS Triage’ collection of artifacts as outlined in KAPE target files.

.\RetrievIR.ps1 -tags sans_triage

After evidence collection is complete, assuming default options were used – parse the evidence!

.\ParseIR.ps1

Capture artifacts relating to browsers and anti-virus tools

.\RetrievIR.ps1 -categories antivirus,browsers

Identify available categories or tags for use with -categories and -tags.

.\RetrievIR.ps1 (-tagscan | -categoryscan)

Responding to Active Threats in Low-Maturity Environments

As a DFIR professional, multiple times I’ve been in the position of having to assist a low-maturity client with containment and remediation of an advanced adversary – think full domain compromise, ransomware events, multiple C2 servers/persistency mechanisms, etc. In many environments you may have some or none of the centralized logging required to effectively track and identify adversary actions such as Windows Server and Domain Controller Event Logging, Firewall Syslog, VPN authentications, EDR/Host-based data, etc. These types of log items are sadly a low-priority objective in many organizations who have not experienced a critical security incident – and while useful to emergency on-board in an active threat scenario, the vast majority of prior threat actor steps will be lost to the void.

So, how can you identify and hunt active threats in a low-maturity environments with little-to-no centralized visibility? I will walk through a standard domain compromise response scenario and describe some useful techniques I tend to rely on for hunting in these types of networks.

During multiple recent investigations I’ve worked to assist clients in events where a bad actor has managed to capture Domain Admin credentials as well as get and maintain access on Domain Controllers through one or more persistency mechanisms – custom C2 channels, SOCKS proxies, remote control software such as VNC/Screen Connect/TeamViewer, etc. There is a certain order of operations to consider when approaching these scenarios – you could of course start by just resetting Domain Admin passwords but if there is still software running on compromised devices as these users then it won’t really impact the threat actors operations – the initial goal should be to damage their C2 operations as much as possible – hunt and disrupt.

  • Hunt – Threat Hunting activities using known IOCS/TTPs, environment anomaly analysis, statistical trends or outliers, suspicious activity, vulnerability monitoring, etc.
  • Disrupt – Upon detecting a true-positive incident, working towards breaking up attacker control of compromised hosts – blocking IP/URL C2 addresses, killing processes, disabling users, etc.
  • Contain – Work towards limiting additional threat actor impact in the environment – disabling portions of the network, remote access mechanisms such as VPN, mass password resets, etc.
  • Destroy – Eradicating threat actor persistence mechanisms – typically I would recommend to reimage/rebuild any known-compromised device but this can also include software/RAT removal, malicious user deletions, un-doing AD/GPO configuration changes, etc.
  • Restore – Working towards ‘business as usual’ IT operations – this may include rebuilding servers/applications, restoring from backups (you are doing environment-wide backups, right?) and other health-related activities
  • Monitor – Monitor the right data in your environment to ensure you can catch threat actors earlier in the cyber kill chain the next time a breach occurs – and restart the hunting cycle.

The cycle above represents a methodology useful not only in responding to active incidents but for use in general cyber-security operations as a means to find and respond to unknown threats operating within your network environment. When responding to a known incident, we are typically in either the hunt or disrupt phase depending on what we know with respect to Indicators of Compromise (IOCs). Your SOC team is typically alerted to a Domain Compromise event through an alert – this may be a UBA, EDR, AV, IDS or some other alert – what’s important is the host generating the event. Your investigation will typically start on that host where it is critically important to capture as much data as possible as your current goal is identify Tactics, Techniques, Procedures and IOCs associated with your current threat for use in identifying additional compromised machines. Some of the data I use for this initial goal is described below;

  • Windows Event Logs – Use these to identify lateral movement (RDP/SMB activity, Remote Authentications, etc), service installs, scheduled task deployments, application installations, PowerShell operations, BITS transfers, etc – hopefully you can find some activity for use in additional hunting here.
  • Running Processes/Command-Lines
  • Network Connections
  • Prefetch – Any interesting executable names/hashes?
  • Autoruns – Any recently modified items stand out?
  • Jump Lists/AmCache – References to interesting file names or remote hosts?
  • USN Journal – Any interesting file names? (The amount of times I’ve found evidence of offensive utilities without renaming in here is astounding)
  • NTUSER.DAT – always a source of interesting data if investigating a specific user account.
  • Local Users/Cached Logon Data
  • Internet History – Perhaps the threat actor pulled well-known utilities directly from GitHub?

These are just some starting points I often focus on when performing an investigation and this is by no means a comprehensive list of forensic evidence available on Windows assets. Hopefully in your initial investigation you can identify one or more of the IOC types listed below;

  • Hostnames / IP Addresses / Domains
  • File Names / Hashes
  • Service or Scheduled Task Names / Binaries / Descriptions / etc
  • Compromised Usernames

The next step is to hunt – we have some basic information to use which can help us rapidly understand whether or not a host is displaying signs of compromise and now we need to check these IOCs against additional hosts in the environment to determine scope and scale. Of course you can and should simultaneously pull on any exposed threads – for example, if you determined that Host A is compromised and also observed RDP connections from Host B to Host A that appear suspicious, you should perform the same type of IOC/TTP discovery on Host B to gather additional useful information – this type of attack tracing can often lead to ‘patient zero’ – the initial source of the compromise.

Back to the opening of this post – how can you perform environment hunting in a low-maturity environment that may lack the centralized logging or deployed agents necessary to support that type of activity? In a high-maturity space, you would have access to data such as firewall events, Windows event logs from hosts/servers/DCs, Proxy/DNS data, etc that would support this type of operation – if you don’t, you’re going to have to make do with what’s already available on endpoints – my personal preference is a reliance on PowerShell and Windows Management Instrumentation (WMI).

WMI exposes for remote querying a wealth of information that can make hunting down known-threats in any type of environment significantly easier – there are hundreds of classes available exposing data such as the following;

  • Running Processes
  • Network Connections
  • Installed Software
  • Installed Services
  • Scheduled Tasks
  • System Information
  • and more…

PowerShell and WMI can be a threat hunters best friend if used appropriately due to how easy it can be to rapidly query even a large enterprise environment. In addition to WMI, as long as you are part of the Event Log Readers group on a local device, you’ll have remote access to Windows Event logs – querying these through PowerShell is also useful when looking for specific indicators of compromise in logs such as User Authentications, RDP Logons, SMB Authentications, Service Installs and more – this will be discussed in a separate post.

As a start, lets imagine we identified a malicious IP address being used for C2 activities on the initially compromised host – our current objective is now to identify any other hosts on our network with active connections to the C2 address. Lets break this problem down step-by-step – our first goal is to identify all domain computers – we can do this by querying Active Directory and searching for all enabled Computer accounts through either Get-ADUser or, if you don’t have the AD module installed, some code such as shown below using DirectorySearcher.

$domainSearcher = New-Object DirectoryServices.DirectorySearcher([ADSI]"")
$domainSearcher.Filter = "(&(objectClass=computer)(!userAccountControl:1.2.840.113556.1.4.803:=2))"
$domainSearcher.PageSize=100000
$domainComputers = ($domainSearcher.Findall())

The code above is used for querying all ‘enabled’ computer accounts in Active Directory using an LDAP filter – read more about LDAP bit-filters here https://ldapwiki.com/wiki/Filtering%20for%20Bit%20Fields. Once we have identified these accounts, we can then iterate through the list in a basic for-loop and run our desired query against each machine – shown below.

$domainSearcher = New-Object DirectoryServices.DirectorySearcher([ADSI]"")
$domainSearcher.Filter = "(&(objectClass=computer)(!userAccountControl:1.2.840.113556.1.4.803:=2))"
$domainSearcher.PageSize=100000
$domainComputers = ($domainSearcher.Findall())
$domainComputers.Properties.dnshostname | ForEach {
    $ComputerName = $_
    $NetworkConnections = Get-WmiObject -Namespace ROOT\StandardCIMV2 -Class MSFT_NetTCPConnection -ComputerName $ComputerName -ErrorAction SilentlyContinue | Select-Object LocalAddress,LocalPort,RemoteAddress,RemotePort,OwningProcess,PSComputerName,State
    $NetworkConnections | Export-CSV -NoTypeInformation -Path '.\DomainNetworkConnections.csv' -Append
}

..and that’s it – you now have a PowerShell script that can be used to query all enabled domain computers via WMI remotely (provided you have the appropriate permissions) and retrieve network TCP connections. Granted, if the C2 channel is over UDP this won’t help you but that’s typically not the case (looking at you stateless malware..). Of course, this is a pretty basic script – how can we spruce it up? Well for starters, we could of course add a progress bar and some log information so we know it’s actually doing something – easy enough.

$domainSearcher = New-Object DirectoryServices.DirectorySearcher([ADSI]"")
$domainSearcher.Filter = "(&(objectClass=computer)(!userAccountControl:1.2.840.113556.1.4.803:=2))"
$domainSearcher.PageSize=100000
$domainComputers = ($domainSearcher.Findall())
$ComputerCount = $domainComputers.Count
$CurrentCount = 0
$domainComputers.Properties.dnshostname | ForEach {
    $CurrentCount += 1
    Write-Progress -Activity "Querying Computers.." -Status "Progress:" -PercentComplete ($CurrentCount/$ComputerCount*100)
    $ComputerName = $_
    Write-Host "Checking $ComputerName"
    $NetworkConnections = Get-WmiObject -Namespace ROOT\StandardCIMV2 -Class MSFT_NetTCPConnection -ComputerName $ComputerName -ErrorAction SilentlyContinue | Select-Object LocalAddress,LocalPort,RemoteAddress,RemotePort,OwningProcess,PSComputerName,State
    $NetworkConnections | Export-CSV -NoTypeInformation -Path '.\DomainNetworkConnections.csv' -Append
}

Looking better – now we have a progress bar letting us know how much is left as well as some communication to the end user describing the current computer being queried. This script, as is, will work – but now the real question is how long will it take? As it stands, this is a single-threaded operation – if your organization has any significant number of servers to query, this can end up taking a very long time. How can we improve this? Multi-threading, of course, is the obvious solution here – lets take advantage of our modern CPUs and perform multiple queries simultaneously in order to expedite this process.

$domainSearcher = New-Object DirectoryServices.DirectorySearcher([ADSI]"")
$domainSearcher.Filter = "(&(objectClass=computer)(!userAccountControl:1.2.840.113556.1.4.803:=2))"
$domainSearcher.PageSize=100000
$domainComputers = ($domainSearcher.Findall())
$ComputerCount = $domainComputers.Count
$CurrentDir = Get-Location
$Config= [hashtable]::Synchronized(@{})
$Config.Path = "$CurrentDir\connections.csv"
$Config.FinishedCount = 0
$ScriptBlock = {
    param($Computer, $Config)
    $cons = Get-WmiObject -Namespace ROOT\StandardCIMV2 -Class MSFT_NetTCPConnection -ComputerName $Computer -ErrorAction SilentlyContinue | Select-Object LocalAddress,RemoteAddress,LocalPort,RemotePort,OwningProcess,PSComputerName,State,PrimaryStatus
    $cons | Export-CSV -NoTypeInformation -Path $Configuration.Path -Append
    $Config.FinishedCount ++
}
$SessionState = [System.Management.Automation.Runspaces.InitialSessionState]::CreateDefault()
$RunspacePool = [RunspaceFactory]::CreateRunspacePool(1, 20, $SessionState, $Host)
$RunspacePool.Open()
$Jobs = New-Object System.Collections.ArrayList
$domainComputers.Properties.dnshostname | ForEach {
    $PowerShell = [powershell]::Create()
	$PowerShell.RunspacePool = $RunspacePool
    $Computer = $_
    $PowerShell.AddScript($ScriptBlock).AddArgument($Computer).AddArgument($Config) | Out-Null
    $Job = New-Object -TypeName PSObject -Property @{
        Runspace = $PowerShell.BeginInvoke()
        Powershell = $PowerShell
    }
    $Jobs.Add($Job) | Out-Null
}

while ($Jobs.Runspace.IsCompleted -contains $false) {
    $x = $Config.FinishedCount
    Write-Progress -Activity "Still Querying: " -Status "Progress:" -PercentComplete ($x/$ComputerCount*100)
    Write-Host (Get-date).Tostring() "Still Querying...[$x/$ComputerCount]"
	Start-Sleep 5
}

Awesome – we now have a multi-threaded script capable of querying remote computers asynchronously through WMI and storing the results of each query in a single CSV file. I’m not going to spend too much time discussing how or why the different components of the above script work – if you’d like to learn more about Runspace Pools and their use in PowerShell scripts, I recommend checking out these links:

Hopefully the usefulness of the code above makes sense from an incident response perspective when you have an IP address you need to use to find additional compromised devices – but what if the attacker is using an unknown IP? As previously mentioned, WMI’s usefulness extends far beyond just gathering TCP connections – we can add to the above script block to gather running processes, installed services, configured scheduled tasks, installed applications and many other pieces of useful information that can serve you well from a hunting and response perspective.

In fact, I’ve found this type of utility so useful that I went ahead and developed it into a more robust piece of software able to accept arguments for data that should be collected, maximum threads to run with, the ability to accept a list of computers rather than always querying AD and the ability to only export results if the result contains one or more specified IOCs provided to the program – Windows Management Instrumentation Hunter (WMIH) is here to help.

GitHub: github.com/joeavanzato/wmihunter

WMIHunter can be used as both a command-line or GUI-based program and enabled asynchronous collection of data via WMI from remote hosts based on enabled Computer Accounts in Active Directory or computers specified in a .txt file supplied to the program. Users can modify the max threads used as well as specify which data sources to target – some can take significantly longer than others. Very soon I’ll be adding the ability to filter IOCs such as IP Addresses, Process Names, Service Names, etc in order to limit what evidence is retrieved.

Give it a whirl in your next investigation.