
Understanding the internals for a particular binary or DLL is important to security researchers and malware analysts in order to critically analyze a software’s capabilities and functionality. Knowing what a piece of code is attempting to perform, the mechanisms it is using to achieve its goals and what the overall impact a piece of software may have on a particular device all contribute towards furthering the development of indicators of compromise and defenses which may be applied to mitigate future attacks.
Two of the most popular techniques for analyzing compiled machine-code binaries are debugging and disassembling, often performed with utilities such as Olly Debug and IDA Pro/Free. This post is focused on the usage of IDA, the ‘Interactive Disassembler’, and some of the benefits it provides analysts in understanding compiled binaries and the functions they possess. IDA is an extremely complex utility and an entire description of the software is outside the scope of this post. Rather, a focus will be spent on discussing some of the major functions and how they contribute towards furthering analysis of binary files.
Immediately upon loading a new binary into IDA, the user will be presented with a myriad of options related to how IDA should interpret, treat and load the specified file. This includes being able to select from various processor types and loading options to allow complete customization and control over how IDA will perform. Some of the available options are shown below.


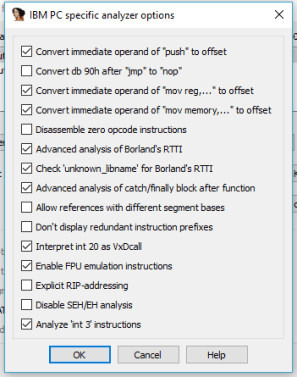
For most standard scenarios of PE file analysis on typical Intel systems, the default options will be fine and most configuration settings will only be modified by advanced users performing particular tasks on niche or minority binaries / systems. Once settings are configured and the user clicks ‘ok’, a standard analysis will take place over the code which will have IDA attempting to review the binary as a whole and make connections between the various user functions which may be in place. Newer versions of IDA have a new default ‘Proximity View’ that is extremely useful in understanding the relationship between user-defined functions and how the business logic of the application will flow between them. An example of this is shown below.

With a specific function highlighted, it is possible to press ‘Space’ to step into an ASM-level view of the function and its debugged structure, with Machine Opcodes transformed on a one-to-one basis into ASM instructions. Obviously this will require some knowledge of how ASM instructions function in order to utilize but there also exists some useful features built-in to IDA to assist analysts who may forget what a certain call performs. A user may select ‘Options -> General’ and then enable ‘Auto-Comments’ and ‘Line-Prefixes’ to make it easier to understand how functions relate and what is occurring on a line-by-line basis in the ASM view, with the two images below giving an example of this when zoomed into the ‘_main’ function.

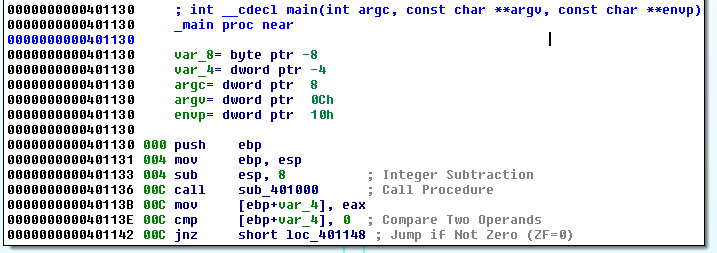
Now IDA is auto-commenting on the individual ASM lines in order to help relieve those who may forget what certain ASM calls are actually performing. Additionally, it is possible and usually necessary for analysts to insert their own comments throughout the code once a pass-through is performed, especially for larger binaries. It is also possible to rename variables and functions to have more meaningful labels, usually done once their purpose is established after some time spent reverse engineering the specific functions and variable usage. This can be done by simply right-clicking the desired variable or line for commenting. If we zoom out on this particular main function, we observe an inter-connection between various code-locations as shown below.

In IDA’s proximity view, blue-connections indicate an unconditional jump is taken, red-connections indicate a conditional jump is not taken and green-connections indicate a conditional jump is taken. These can be useful in assessing how the application’s logic is performing with respect to the various code-blocks, but first we should back up slightly and get a larger picture of the binary as a whole before beginning to assess individual user functions. Using ‘View -> Open Subviews -> Imports’ will present a list of detected functions imported by the binary which have been mapped by the default Signature Analysis within IDA. Using ‘Shift+F5’ will open the Signatures window to view the currently applied signatures and it is possible to apply signatures associated with additional compilers and libraries if the user wishes to by simply right clicking within the signature window. Understanding the functions which are imported from specific Windows libraries can help an analyst gain some expectations as to the general capabilities of a specific binary. For example, in the below screenshot we observe that certain functions such as InternetReadFile and InternetGetConnectedState are imported from WININET, indicating this specific binary likely contains some type of command and control mechanism which allows it to retrieve additional modules, information or controls from a remote resource.

Functions such as these can lead to the development of good network indicators of compromise if they are utilizing fixed URLs, hostnames or IP addresses within the code. In order to determine if this is the case, it is possible to track where the function is being called and understand how it is being used. To do this, lets double-click one of the functions such as InternetOpenUrlA and have IDA take us to the .idata section of the binary. This will appear similar to the image given below.

Simply observing the .idata section will not necessarily provide us with any more information than the function window alone, but here it is possible to view what is known as the ‘cross-references’, the locations in the code where these functions are actively being called for processing. This can be done simply by pressing ‘Ctrl+X’ to view Cross-References-To the specific function after highlighting the desired function. An example of this is shown below.

Doing so, we can observe that InternetOpenUrlA is called in one developer-defined function which may be of relevance to analysts attempting to understand how it is being used. In order to go to this function, we can simply click ‘Ok’ in the dialog box and IDA will take us straight to the relevant code snippet. This code which belongs to the function referred to at address ‘sub_401040’ is shown below.

In the screenshot of the function above, we immediately observe a string offset consisting of a static URL being pushed to the stack and utilized in the call to InternetOpenUrlA, indicating that this specific binary is attempting to reach the specified remote address for reasons which are yet unclear.
This is not the only method of initial analysis which may be possible for these sorts of binaries. Pressing ‘Shift+F12’ or opening the ‘View -> Open Subviews – > Strings Windows’ will bring up a list of all detected ASCII strings present in the binary. Studying the strings present in the binary can present the analyst with interesting or intriguingly anomalous strings which may lead to the most interesting parts of the software functionality. An example view of the Strings window is shown below.
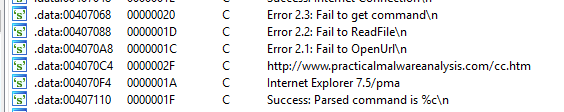
Here we can see that the URL discovered above through cross-referencing the InternetOpenUrlA function imported from WININET is immediately present and detected as an existing string. In order to figure out where this string is being utilized in the binary, we can once again double-click the item and then IDA presents us with the location in .data where the string offset is being stored, shown below.

Similarly to before, we can use ‘Ctrl+X’ to find out where this string is being cross-referenced in the binary, shown in the image below.

We can observe that it is being utilized in the same function as derived earlier in this post. Clicking ‘Ok’ in this dialog box will lead us to the same ‘sub_401040’ developer-defined function which has previously been presented, as expected. This type of analysis is useful in order to quickly highlight and discover portions of code which may be the most relevant to determining network or host based indicators of compromise necessary to mitigate future attacks related to specific malicious software binaries, allowing enterprise-scale organizations to act quickly with respect to proactive security measures.
This concludes a basic and brief introduction to the usage of IDA in understanding how to begin reverse engineering malicious binaries and to assess portions of their contents, capabilities and impact. Both the functions imported and internal strings can give analysts important insight as to the potential consequences and risks a piece of software may post to an organization or device.
